Microfluidic cell perfusion with a syringe pump
Author
Lisa Muiznieks, PhD, Ivana Brenta, M.Sc., & Kaiyang Chen
Publication Date
December 2024
Keywords
cell perfusion
syringe pump
cell culture
flow profil
flow control
continuous perfusion
cell viability
Need advice for your microfluidic cell perfusion?
Your microfluidic SME partner for Horizon Europe
We take care of microfluidic engineering, work on valorization and optimize the proposal with you
Introduction
Cell culture is a fundamental technique widely used in various areas of biological research and pharmaceutical development. In order to support the in vitro growth and viability of cultured cells, multiple factors must be carefully considered, including temperature, pH, and nutrients.
Microfluidics is a technique that enables cells to be cultured on the microscale with very high control over environmental parameters. Among these factors, the ability to precisely regulate the flow of medium and other solutions over cells in a microfluidic chip is important for increasing the physiological relevance of their microenvironment compared to static culture models.
In this context, the pump plays an important role in the setup. Microfluidic pump selection should be considered with respect to flow stability and flow rate profile, in addition to experimental needs specific to the application (e.g. recirculation, perfusion volume and time etc), while keeping usability in mind (see: Microfluidic pump flow profiles: a comparative review). Syringe pumps are a commonly used option for cell culture applications. This application note demonstrates the setting up of a syringe pump for cell perfusion and measures the flow profile generated.
Applications
Cell perfusion on the microscale has wide applications in fundamental biological research, disease modelling and the medical and pharmaceutical industry, including:
- Live cell imaging and analysis (2D, 3D cultures)
- Microphysiological systems; organ-on-chip; barrier models
- Cell rolling and adhesion assays
- Shear stress studies
- Molecular transport
- Drug screening
- Behavioural and developmental studies (e.g. worm-on-chip)
Setup

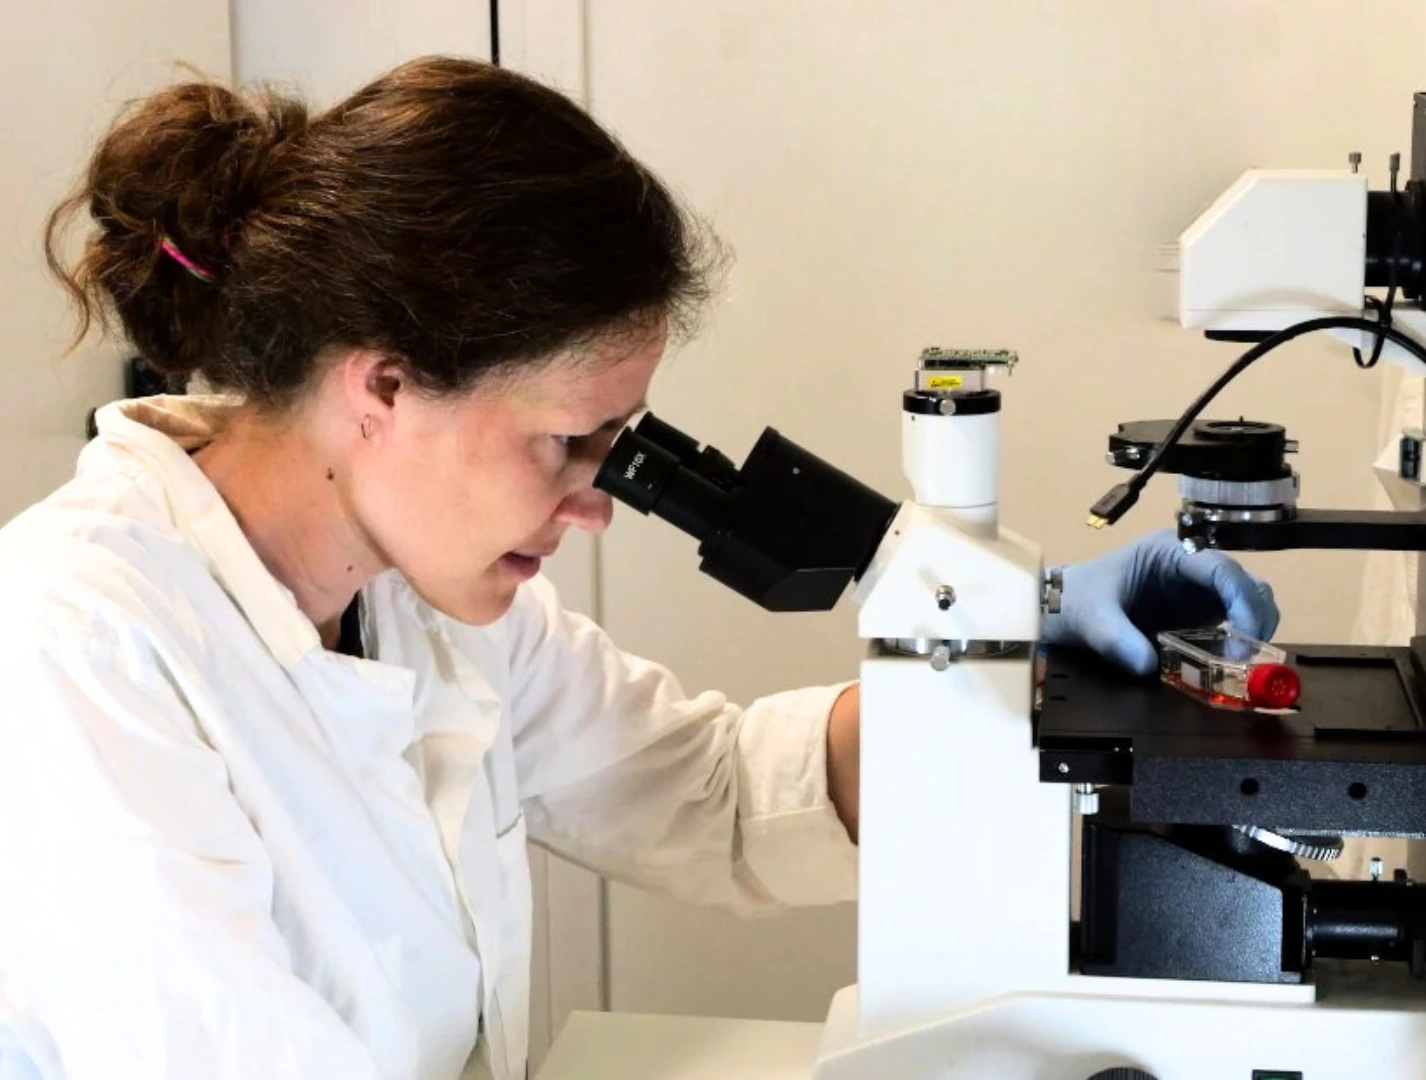
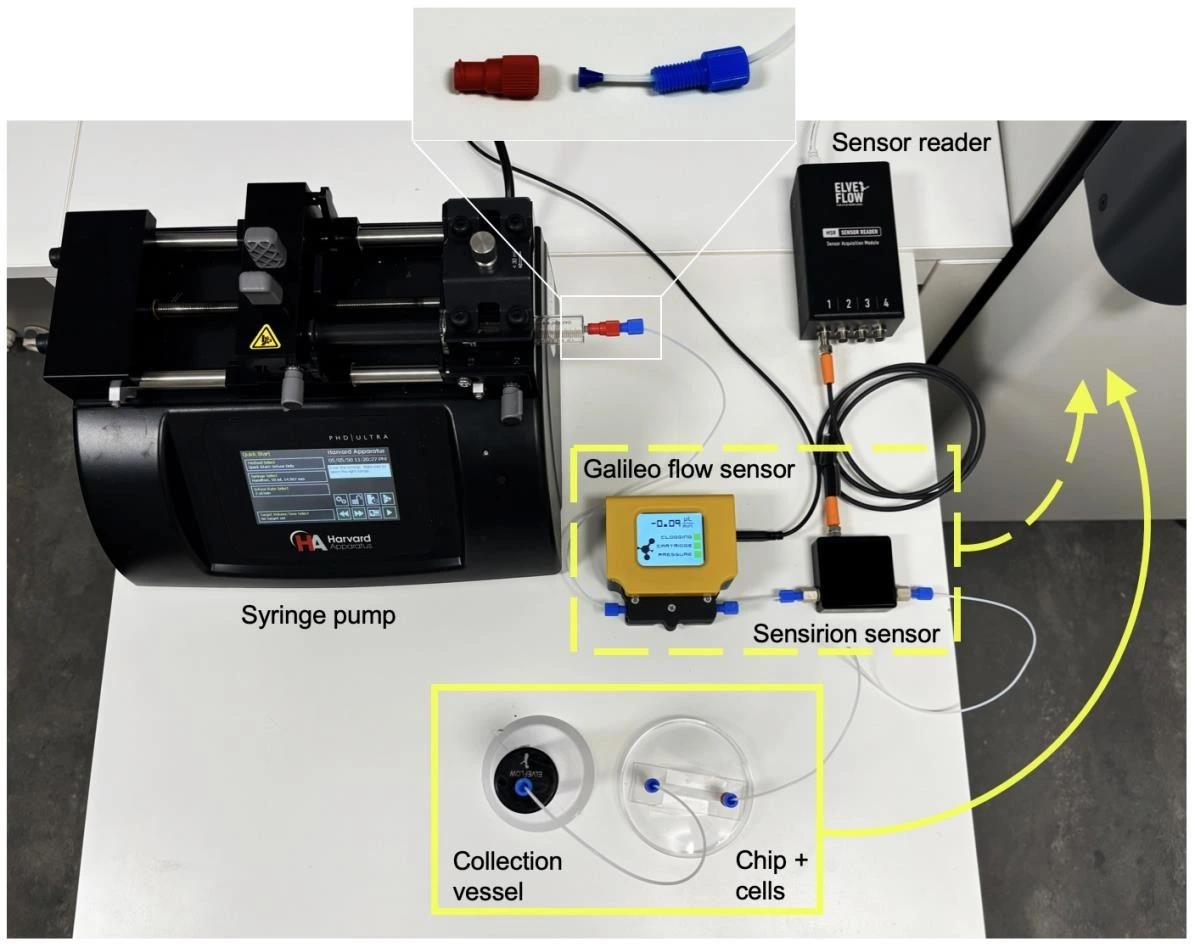
In this setup, a Standard Infuse/Withdraw PHD ULTRA™ Syringe Pump (Harvard Apparatus) was used to push the medium in one direction through a microfluidic chip seeded with cells.
Syringe pumps are commonly used to control the flow without the strict need for inline flow sensors. However, this can lead to over-reliance on factory instrument calibration and loss of high-precision data such as flow profiles or potential flow perturbations. In this application note, we connected two flow sensors in order to verify the performance of the syringe pump and to measure the pulsatility of the flow profile. We used a commercially available Sensirion flow sensor (LG16-0431D, connected to a sensor reader; see image: Full fluidic setup) and our new Galileo flow sensor that features a wide sensing range, clogging detection, and measurement drift alert.
Materials
Hardware:
- Syringe pump (Standard PHD ULTRA™ CP Syringe Pump, Harvard Apparatus)
- Syringe (e.g. 10 mL glass, Hamilton)
- Microfluidic chip (e.g. µ-Slide I Luer, ibidi ®)
- Tubings (PTFE, 1/16” outer diameter; OD), fittings
- 1 x 50 mL Falcon tube and reservoir cap
- [Optional] Galileo flow rate sensor (e.g. 1-200 µl/min cartridge; waterproof, if to be used in a CO2 incubator)
- [Optional] Sensirion flow sensor (e.g. LG16-0431D, 2-80 µl/min) and sensor reader (e.g. MSR, Elveflow)
Reagents:
- Cells (e.g. U-251 MG GFP; 0.6-0.8 x 10⁶ cells/ mL)
- Medium: DMEM ([+] 4.5g/L D-Glucose; with 10% FBS, Penicillin/ Streptomycin (100 U/mL; 100 µg/mL)
- Phosphate buffered saline (PBS)
- Propidium iodide (PI) cell stain (75 µM)
Download the MIC Horizon Europe 2026/2027 Calls Calendar:
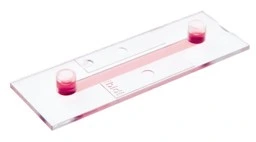
Design of the chip
This experiment used a straight channel chip (µ-Slide I Luer 0.4; ibidi ®). The simple design and large internal geometry of the chip make it straightforward to fill, seed and connect to the circuit. Its polymer coverslip base and microscope slide outer dimensions are ideally adapted for imaging, either as part of an endpoint staining protocol or for live cell imaging to monitor cell proliferation and morphology during perfusion.
µ-Slide I Luer 0.4 (ibidi ®) | Features |
Interface type | Female Luer |
Chamber volume | 100 µl |
Channel l ✕ w ✕ h | 50 ✕ 5 ✕ 0.4 mm |
Surface treatment | ibiTreat tissue culture treated |
Slide base | #1.5 polymer coverslip |
Quick start guide
Instrument connection and filling
1. Connect your syringe pump to a power supply following the manufacturer’s instructions.
2. Click the Galileo cartridge into its base.
3. Connect the Galileo base to a computer (USB type C-to-type C or USB type C-to-type 2). Open the Galileo software and click “Connect Galileo” on the interface.
4. Select your working liquid from the dropdown menu and click “Apply”.
5. Connect the Sensirion flow sensor to the sensor reader and software as directed by the manufacturer.
6. Select an appropriate syringe for your experiment and sterilize or disinfect it as required as per manufacture’s recommendations. This experiment used a 10 mL glass syringe (Hamilton) disinfected with ethanol (70%).
7. Fill the syringe with medium in a Biosafety hood to maintain sterility.
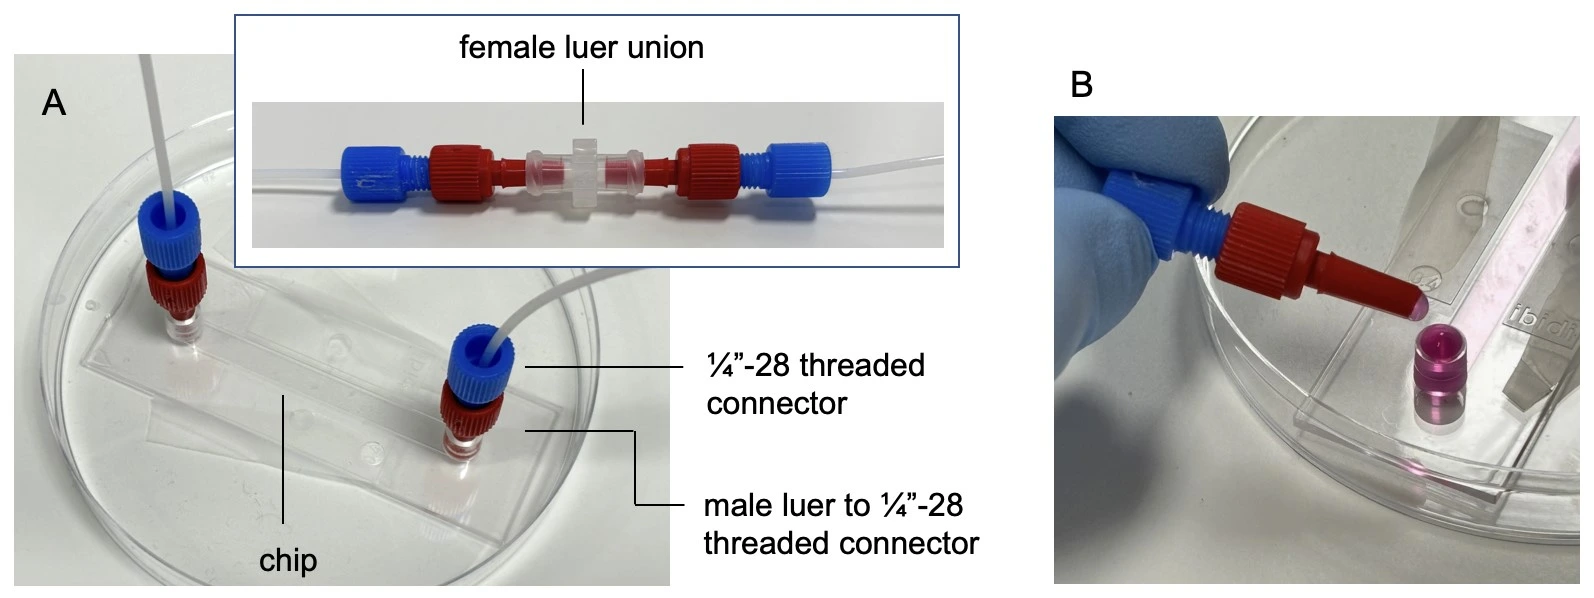
8. Attach tubing (1/16” ID PTFE) to the end of the syringe with a female threaded Luer adapter and a ¼”-28 threaded connector and ferule (see image below: Full fluidic setup).
9. Secure the syringe in the syringe pump as per the manufacturer’s instructions.
10. Connect the tubing from the syringe to the inlet of the Galileo flow sensor cartridge.
11. Connect the outlet of the Galileo flow sensor cartridge to the inlet of the Sensirion flow sensor.
12. Connect the Sensirion flow sensor to a sensor reader (e.g. MSR, Elveflow) and set up the sensor as per the manufacturer’s instructions.
13. Connect the outlet of the Sensirion flow sensor to a female Luer union (in place of the seeded chip for initial system filling) and connect the collection/ waste container.
14. Start the syringe pump and completely fill the system with medium.
Chip preparation and seeding
1. Add surface coating, if desired. Note that a hydrophilized surface is suitable for cell attachment without additional treatment.
2. Prepare cell suspension as per standard protocols. Ensure all cell clumps are gently but well dissociated and count carefully. Use the suspension immediately.
3. Seed a µ-Slide I Luer 0.4 chip with a cell density of 0.6-0.8 ´ 106 cells/mL using a pipette. Position the pipette tip at the base of the inlet right at the entrance to the channel and apply slow and gentle pressure to avoid generating air bubbles.
4. Cover inlets/ outlets and leave 6-18 h in the CO2 incubator for cells to attach, or as needed for the application.
Chip connection to fluidic circuit
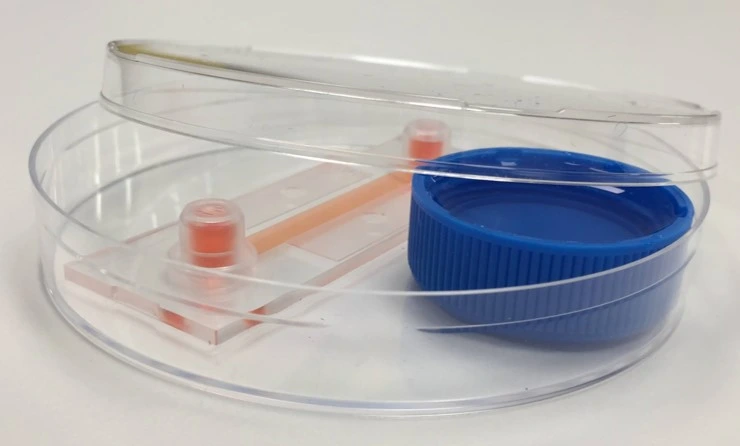
1. Tape the chip to a sterile petri dish for maximum stability and mark on it the direction of flow.
2. Remove the female Luer union. Connect the chip by touching the small droplet of medium at the tip of the connector to the meniscus of the medium at the chip inlet, to avoid trapping air.
3. Connect tubing to the outlet of the chip. Carefully wipe away any medium from the outside of the chip. Perform a visual inspection about 1 h after starting the experiment to ensure there are no leaks.
Experiment
1. Set desired flow rate on the syringe pump interface, e.g. 2 µl/min.
2. Start flow and leave for desired time, e.g. 24 h.
3. Analyze results of the cell perfusion experiment, e.g. stain and image cells in the chip or perform downstream analysis of collected aliquots of medium as desired.
Results
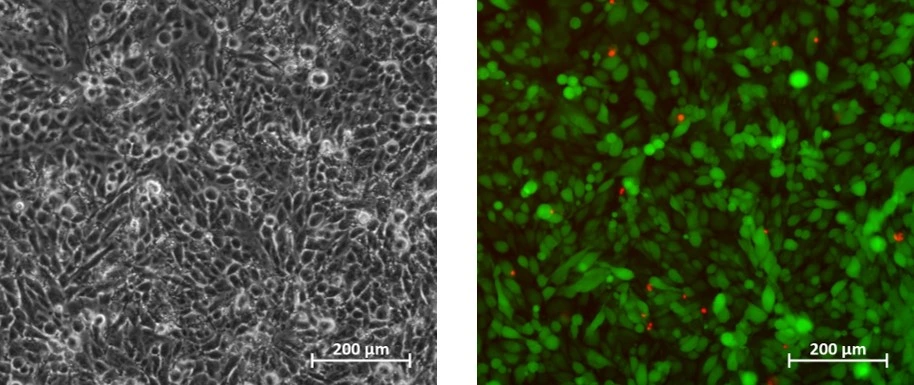
Cells were cultured in a microfluidic chip with constant perfusion (2 µl/min) using a syringe pump. After 24 h, cells were stained in the chip with propidium iodide (Fig. 1). The accuracy and flow profile of the syringe pump was measured using 2 flow sensors (Figs 2, 3).
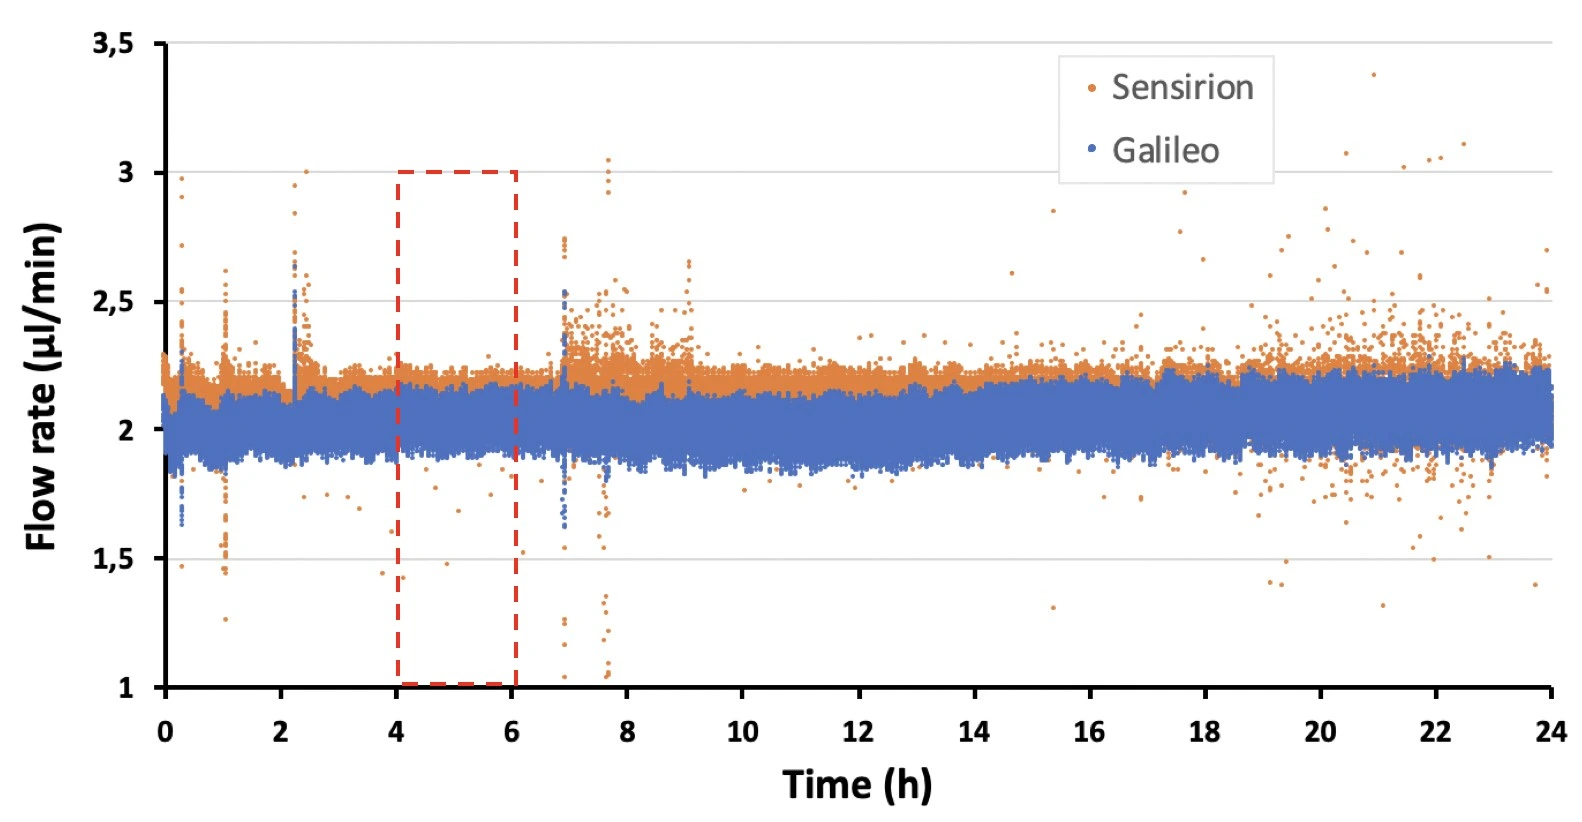
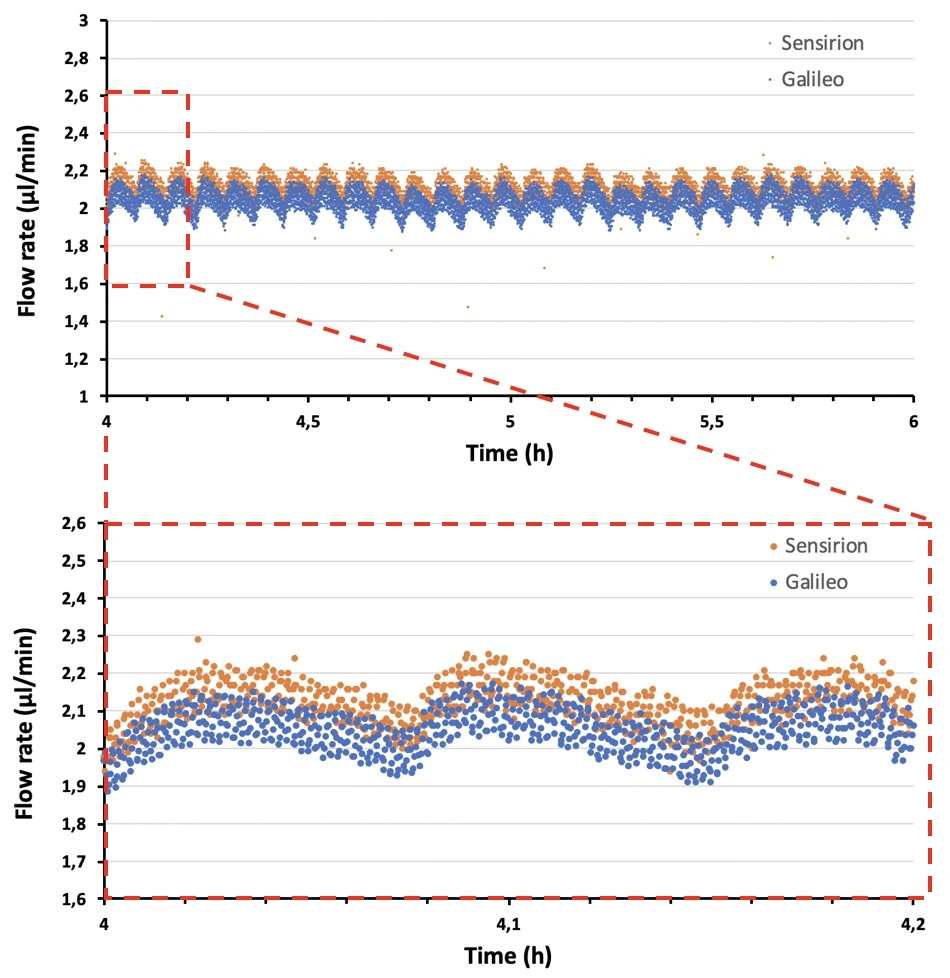
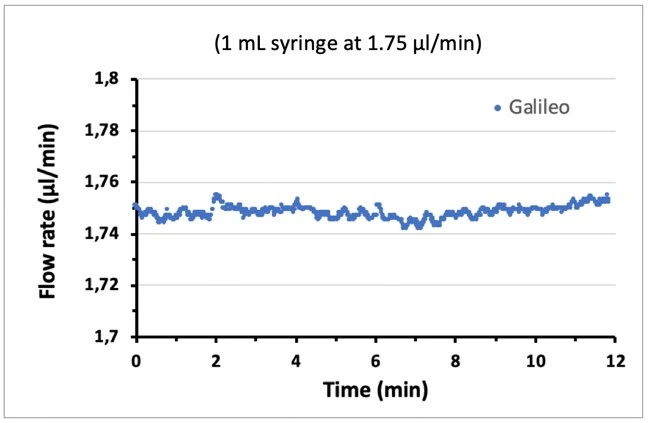
The syringe pump produced an oscillating flow profile (with a 10 mL syringe) due to the action of the step motor.
Note that using a smaller volume syringe (smaller barrel diameter) can result in smaller flow rate oscillations (figure, right). However, the syringe volume should be selected based on the flow rate and experiment length, e.g. a syringe of 1 mL volume can dispense liquid at a rate of 2 ml/min for a maximum of 8.33 h before becoming empty, while a 10 mL syringe can dispense at this flow rate for over 3 days.
More tips included in the Application Note PDF!


Acknowledgements
This application note has received funding from the European Union’s Horizon research and innovation program under HORIZON-EIC-2022-TRANSITION-01, grant agreement no. 101113098 (Galileo), and H2020-MSCA-RISE-2020, grant agreement no. 101007804 (Micro4Nano).
This application note was written by Lisa Muiznieks, PhD, Ivana Brenta, M.Sc., and Kaiyang Chen.
Published on December 2024
Contact: Partnership[at]microfluidic.fr


Check the other Application Notes
FAQ - Microfluidic Cell Perfusion with a Syringe Pump
What’s the core idea behind this application note?
Avoiding bubbles and sudden pressure shifts takes priority when delivering nutrients steadily across a microfluidic chamber. Steady flow rates matter just as much as minimizing mechanical strain on delicate tissues during extended operation. Most pitfalls arise from overlooked details – air pockets, inconsistent calibration, and slow degradation of performance. Using nothing beyond an ordinary syringe pump simplifies adoption without sacrificing reliability. Precision emerges not from complex gear but consistent execution. Labs can gain a working model quickly, often within hours rather than weeks.
Why use a syringe pump for live-cell perfusion instead of pressure control?
Available almost everywhere, syringe pumps allow precise volume control with straightforward programming. When slow, smooth delivery matters over long durations, these devices work well – as long as system elasticity and pulse effects are managed. Though pressure systems adjust more quickly to shifts and are suited to shifting conditions, stability in one-chamber setups usually favors the simpler tool. A steady hand often finds better results without switching methods.
Which flow-rate levels work best when dealing with attached or delicate cells?
Most microchannels – between 200 and 800 micrometers wide, 50 to 200 micrometers high – operate well at flows from half a microliter to fifty per minute. When rates dip below one microliter per minute, molecules spread mostly by diffusion, slowing the rate of nutrient renewal. Pushing beyond thirty to fifty often raises shear forces enough to trouble sensitive cell types. Because shape affects force distribution, calculate the actual wall shear stress for your setup before choosing a fixed flow.
What method calculates shear stress using your measured flow rate?
When dealing with a rectangular channel – where width is w, height is h, and h is much smaller than w – an approximate value can be useful
τ_w ≈ 6 μ Q / (w h²),
Wall shear stress, denoted by τ_w in pascals, depends on viscosity (μ) measured in Pa·s and the volume of fluid moving per second (Q) in cubic meters per second. Take DMEM at body temperature – viscosity around 0.7 to 0.8 millipascal seconds – with a channel height of 100 micrometers, width of 500 micrometers, and flow set to 5 microliters each minute; under these conditions, τ_w typically reaches values between 0.5 and 1.0 Pa. Most mammalian cells can withstand such levels for extended periods. When lower forces are required, say, below approximately 0.2 Pa, altering either the channel dimensions or the flow rate helps achieve that target.
How do certain hands-on methods maintain consistent momentum across long stretches of time?
- Starting with the largest syringe diameter helps maintain steady fluid delivery. Slower plunger motion comes naturally when the tube is broader. Pulsing reduces because pressure spreads more evenly across each push.
- Avoid long, flexible inlet tubes since shorter, rigid ones handle pressure better. Compliance drops when the pathway resists expansion under flow.
- Begins with removing gas from the medium early. Warming helps – best done before insertion, when feasible. Temperature near the operation level improves readiness once loaded.
- A slight ripple? Try including a tiny upstream damper. Alternatively, fit a backup compliance loop. These help smooth out repeating waves in the flow.
How do I deal with bubbles and outgassing in incubators?
Start by loading the media slowly – fill syringes from the back to reduce trapped air. Right before the chip, include a bubble catcher in the setup. Wait about 10 to 15 minutes for the temperature to stabilize before introducing cells. For small floating bubbles, gas-permeable tubing works well, yet longer lengths increase flexibility where stiffness is better; aim for minimal length. Where humidity shifts occur inside the incubator, place a water-repelling filter at the peak of the liquid path.
How does the body handle nutrients and waste when blood moves slowly?
Even at 1-5 µL/min, convection refreshes the pericellular space orders of magnitude faster than static culture. To verify, you can do a tracer step test (e.g., fluorescein) and measure the wash-in time constant in your chamber. For long runs, plan ~1.2-1.5× the theoretical media volume to account for priming and minor losses; log actual delivery so viability and secretome data can be interpreted quantitatively.
What method adjusts the real flow rate – rather than the setpoint – to match intended values?
When compliance shifts or back pressure changes, the set flow rate may not match the actual flow inside the chip. A dependable method begins with running fluid at the desired rate for several minutes. Following that, capture the output in a container previously weighed. Hold this collection period steady – say, twenty minutes. Then measure the new weight. Convert the mass to volume using known density values, then calculate the observed flow rate. Should this measured value drop each time, consider reducing the tube length and inspecting the flexible parts. On the other hand, when readings exceed expectations, examine the device’s seals and connection points.
What role does heat play alongside fluid thickness in shaping the procedure?
A small rise in heat often thins water-based fluids by around two to four percent for each degree. Working warmer than your measurement point can mean the forces on cells may fall short of expected values. To match real conditions, adjust instruments to account for fluid resistance changes using the viscosity ratio at body and room temperatures. Adding thickening agents like methylcellulose shifts flow behavior – double the thickness, double the wall force at constant flow rate.
Which problems might appear right away?
- Slow drift: A typical issue involves a gradual loss of pressure – flow diminishes by 5-15% over an hour. This often stems from flexible tubing that expands under pressure. A solution lies in using a less elastic material, reducing the tube length, or opting for a larger syringe.
- Microbubble streaks across the monolayer: often caused by gas leaving the liquid phase. Extending the equilibration time helps reduce this effect. Adding a device to capture bubbles can also prevent them from forming.
- Edge-only perfusion in wide chambers: In wide chambers, flow tends to stall at the center while edges receive full perfusion. To balance shear stress across the space, placing small obstacles, such as posts, can redirect fluid motion. Alternatively, scaling down the chamber’s width or height helps maintain more uniform movement throughout. Stagnation diminishes when geometry guides consistent flow patterns.
Can I automate media changes or dose-response profiles with a syringe pump?
True. Using a dual-syringe setup with minimal dead space allows sharp transitions in flow rate. When measuring responses across doses, apply gradually increasing target rates – say, 2 to 4 to 8 microliters per minute – with consistent pauses at each level, or alternate between syringes loaded with distinct solution strengths. Record timing of every change precisely, linking these markers directly to image captures during microscopy; doing so simplifies analysis afterward by reducing uncertainty.
What role does the Microfluidics Innovation Center play when shaping a grant proposal or early-stage product model?
Starting with a chip shape tuned to specific flow stress, MIC builds full perfusion systems. Fluid control remains steady regardless of pump behavior, thanks to balanced design choices. A biologist can run the entire setup right away, with minimal oversight required. Custom microchips are manufactured in our own fabrication line. When necessary, sensors are installed in the channels during production. Working models are ship-ready to test. Within EU projects funded by Horizon Europe, including niche experts such as the MIC lifts project, project maturity is improved. Recent funding data shows approval odds nearly twice the average when we join early. Methods and checks are drafted together, making verification clear for evaluators – not just promised.
What little details do those who review work or run labs tend to value?
Start by capturing channel measurements through microscope imaging, always adding scale indicators. Alongside flow rate values, state the wall shear stress clearly. Mention the brand and inner width of the syringe employed. List both inner and outer diameters for any tubing involved. Confirm accuracy using a single mass-over-time check when additives or specific serum batches were applied, record fluid thickness, or, at a minimum, ambient warmth during tests.