Automated sample collection
Author
Lisa Muiznieks, PhD,
Francesca Romana Brugnoli, PhD
Publication Date
Keywords
automated sampling
sample handler
inline collection
automated workflow
sample integrity
microglia cells
Need advice for your sample collection?
Your microfluidic SME partner for Horizon Europe
We take care of microfluidic engineering, work on valorization and optimize the proposal with you
Introduction
Automated sample collection is an effective way to simplify the precise gathering of biological samples at specific time points during an experiment. Through this function, the user can systematically monitor the progression of reactions to study time-dependent behavior of molecules and complex biological pathways. Such data can increase the understanding of many processes including cell-to-cell communication, immune responses, and metabolic pathways, enriching the depth of insights within the biological sciences.
Microfluidic chip geometries and flow control add substantial physiological relevance to the microenvironment of cells in vitro. Pressure-driven flow controllers are particularly well suited for flow control due to their high precision and accuracy, including the task of automated, reproducible volume dispensing down to tens of microliters per sample.
Applications of automated sample collection
- Metabolism studies, e.g. changes in nutrients or chemicals concentration and availability, for homeostasis, feedback and regulation.
- Metabolism of chemical compounds and drugs for assessment of efficacy, toxicity and lifetime.
- Temporal release of molecules, e.g. during inflammatory and immune responses.
- Molecular efflux from cells, e.g. via membrane channels, neurotransporters or during cell lysis.
- Uptake of labeled proteins, markers, neurotransmitters, drugs or metabolites.
- Testing inhibitors and promoters of molecule uptake and release.
This application note demonstrates the automated sample collection of microliter volumes of supernatant during the perfusion of primary mouse microglia in order to monitor cell activation over time due to mechanical forces of flow.
Microglia are the resident immune cells of the brain. They monitor the environment and in case of injury, damage or infection they move to the site of interest and initiate an immune response.
The signal that triggers the active state of the cells can be chemical or mechanical stress. Piezo1 is a mechanosensitive channel found in astrocytes and is also expressed by myeloid cells, including microglia. It has been shown that it also mediates immune functions in microglia in response to mechanical forces. Here, the release of TNF-ɑ through Piezo1 was tracked when 3 different flow rates were applied to the system.
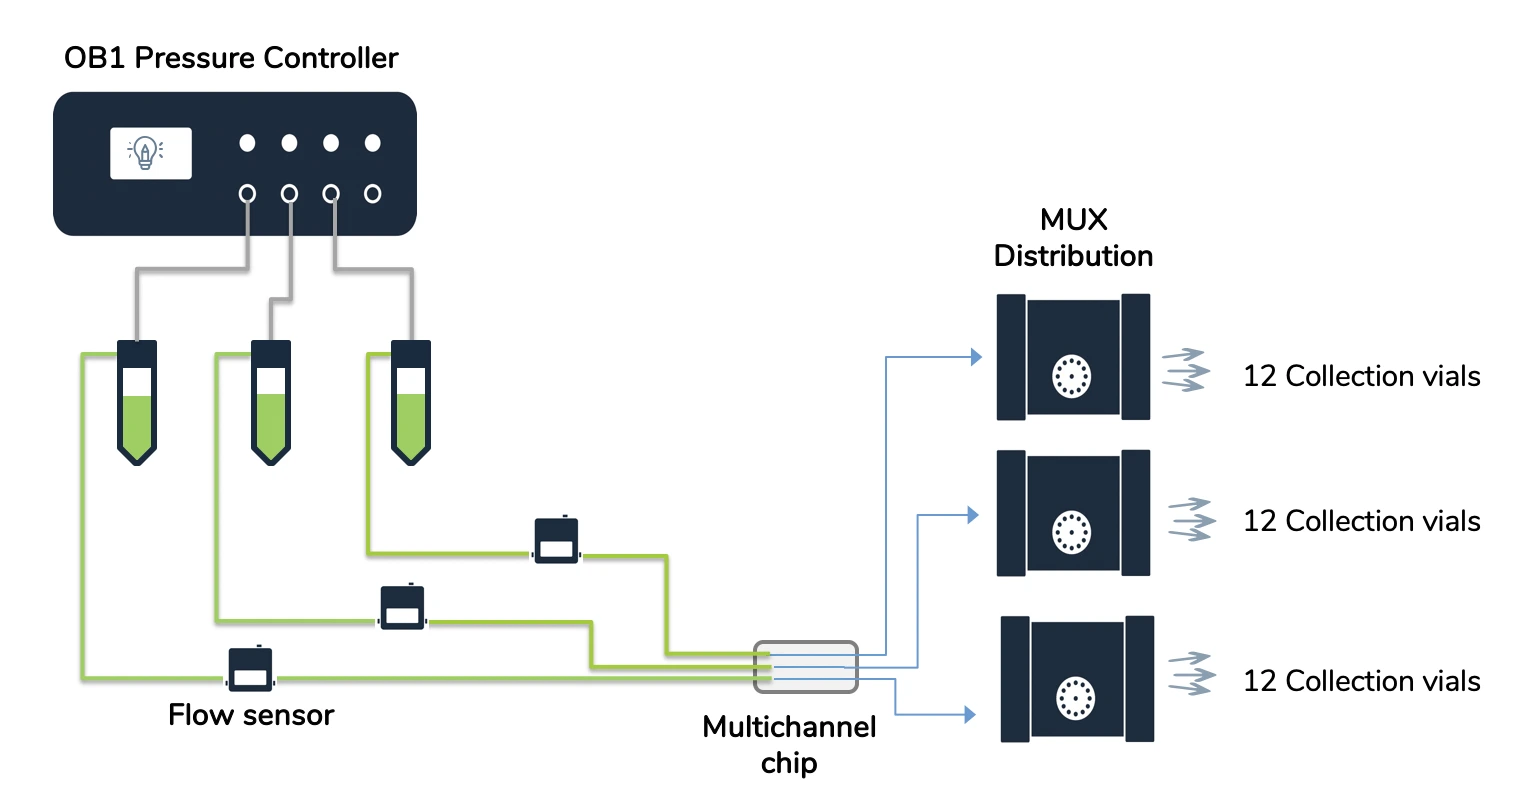
Experiment setup
Flow controller OB1 (Elveflow)
MUX distribution (Elveflow)
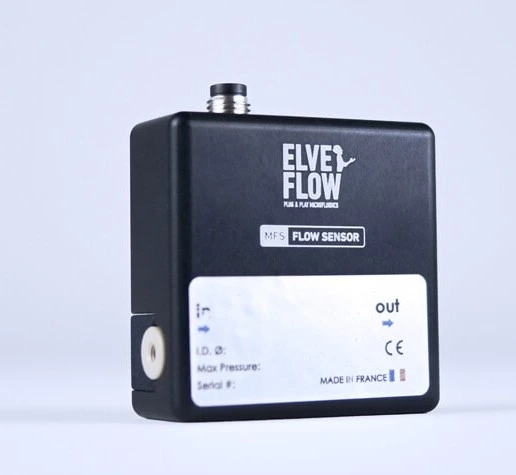
Flow sensor (Elveflow)
Materials
Hardware:
- OB1 MK4 flow controller (Elveflow) with at least three 0–2000 mbar channels
- Flow sensors, 2x MFS2, 1x MFS3 (Elveflow)
- 3x MUX Distribution valves (Elveflow)
- Tubing (1/32” inner diameter, ID), fittings and reservoirs
- 75 cm of 65 μm ID microfluidic resistance
- Multi-channel chip from microfluidic ChipShop GmbH, e.g. Fluidic 138
- Laminar flow hood
- CO2 Incubator
Chemicals:
- DMEM ([+] 1g/L D-Glucose, L-Glutamine, Pyruvate; Gibco)
- Penicillin/ Streptomycin (10,000 U/ml Penicillin, 10 mg/ml Streptomycin; PAN Biotech)
- FBS Good (0.2 μm sterile filtered; PAN Biotech)
Software:
- ESI software
Design of the chip
A microfluidic chip with multiple channels was selected for this application note in order to highlight the ability of our setup to collect multiple samples from three simultaneous assays, i.e., using different flow rates.
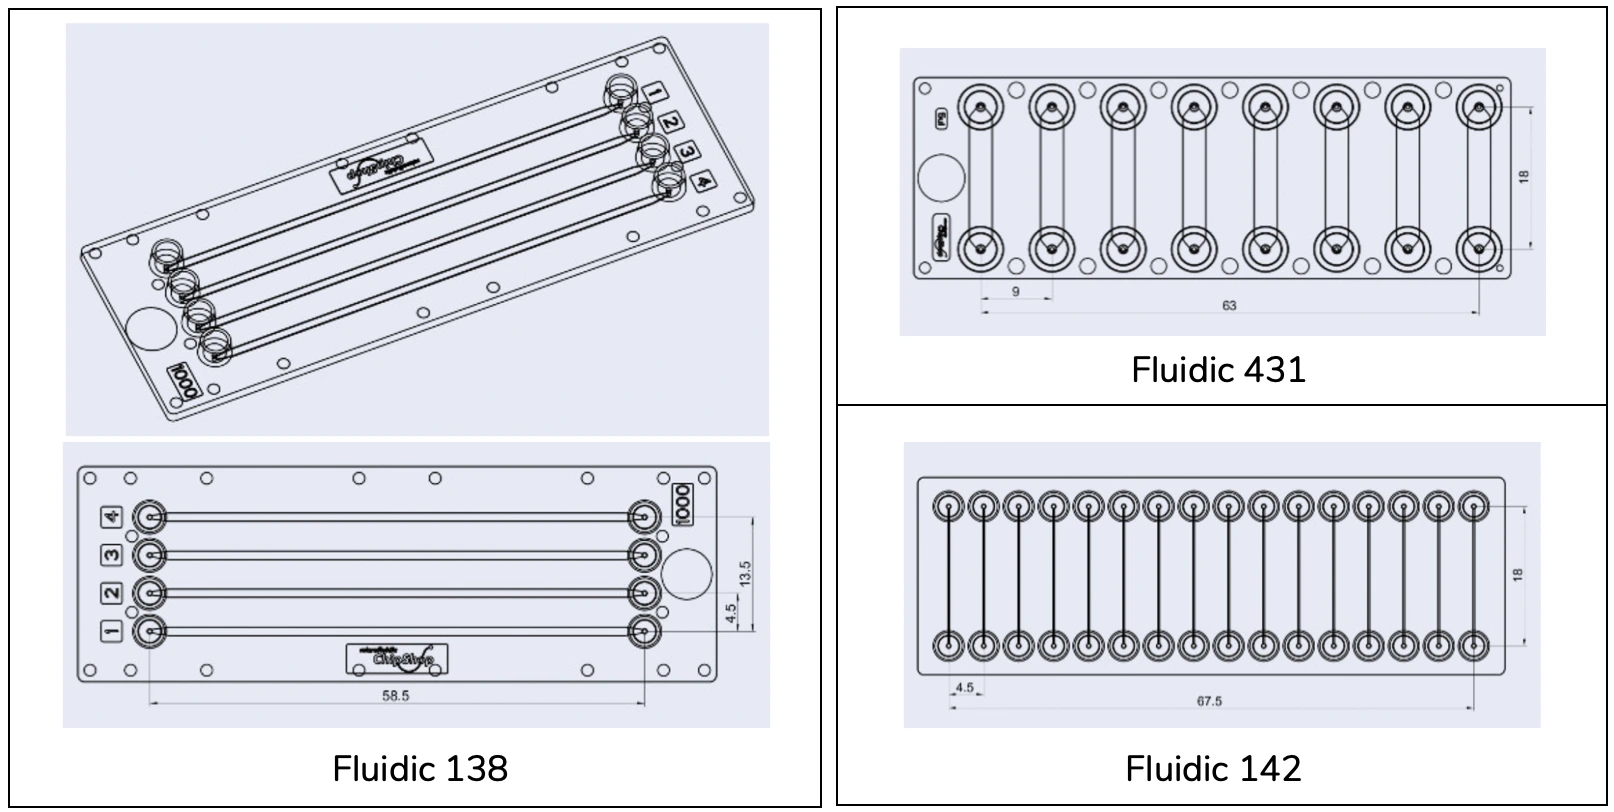
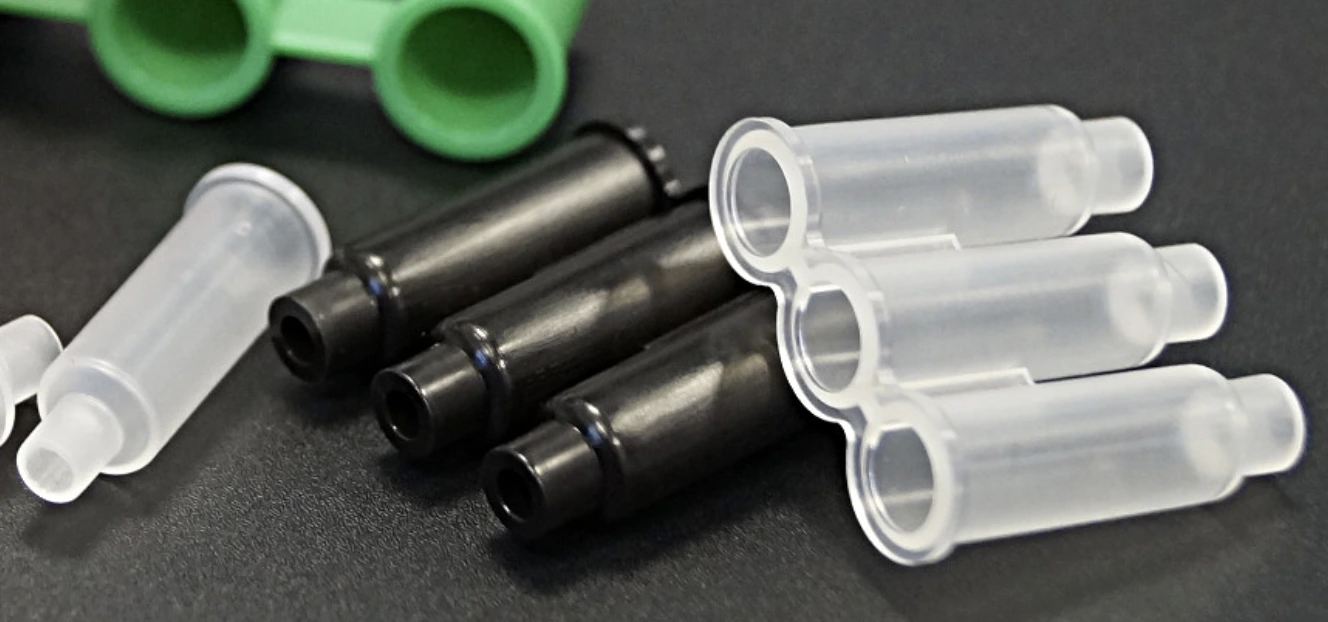
Multichannel chips suitable for this assay include microfluidic ChipShop GmbH Fluidic 138, Fluidic 431, and Fluidic 142 (above). Here, we used Fluidic 138. Details of chip features are given below (dimensions are shown in [mm]).
Details of Fluidic 138
| Fluidic 138 | Features |
| Interface type | Female Mini Luer |
| Channel length | 58.5 mm |
| Channel width | 1 mm |
| Channel height | 0.2 mm |
| Chip material | Topas |
Fluidic 138 has four separate, parallel straight channels. Different fluidic interface options and chip materials are available for this design. Other suitable chip designs have up to 16 parallel channels per chip. Always check the channel height of the chip you wish to use to ensure there is enough clearance for cells in suspension to enter the channel. Chips are also available with hydrophilization surface treatment. Ultimately, the choice of the chip depends on the cells and the application.
Download the MIC Horizon Europe 2026/2027 Calls Calendar:
Quick start guide for the automated sample collection
Instrument connection
1. Connect your OB1 pressure controller to an external pressure supply using pneumatic tubing, and to a computer using a USB cable. For detailed instructions on OB1 pressure controller setup, please read the “OB1 User Guide”.
2. Connect the flow sensors to the OB1. For details refer to “MFS user guide”.
3. Turn on the OB1 by pressing the power switch.
4. Launch the Elveflow software. The Elveflow Smart Interface’s main features and options are covered in the “ESI User Guide”. Please refer to the guide for a detailed description.
5. Press Add instrument \ choose OB1 \ set as MK4, set pressure channels if needed, give a name to the instrument and press OK to save changes. Your OB1 should now be on the list of recognized devices.
6. OB1 calibration is required for the first use. Please refer to the “OB1 User Guide”.
7. Add the flow sensors: press Add sensor \ select flow sensor \ analog or digital (choose the working range of flow rate for the sensor if you have an analog one), give a name to the sensors, select which device and channel the sensor is connected to and press OK to save the changes. Your flow sensor should be on the list of recognized devices. For details refer to “MFS user guide”.
8. Add the three MUX Distribution: Press Add instrument \ choose MUX Distrib/Inj/Rec, give a name to the instrument and press OK to save changes. Repeat for each MUX Distribution.
9. Open the OB1 Window.
10. In the OB1 window, for each operating channel \ flow control regulation tab, P and I values can be selected to tune flow stability and responsiveness. For this application both values were set to 0.001 because microglia cells are very sensitive to shear stress.
Chip preparation and seeding
1. Add surface coating, if desired. Note that a hydrophilized surface is suitable for cell attachment without additional treatment.
2. Prepare cell suspension as per standard protocols. Ensure all cell clumps are gently but well dissociated and count carefully. Use the suspension immediately.
3. Seed channels with a cell density of 0.5-1 x 10⁶ cells/mL. Fill Fluidic 138 by attaching a Mini Luer to Luer adaptor to the inlet and then connecting a 5 mL syringe. Apply slow and gentle pressure.
4. Cover inlets/ outlets and leave 4-16 h in the CO2 incubator for cells to attach.
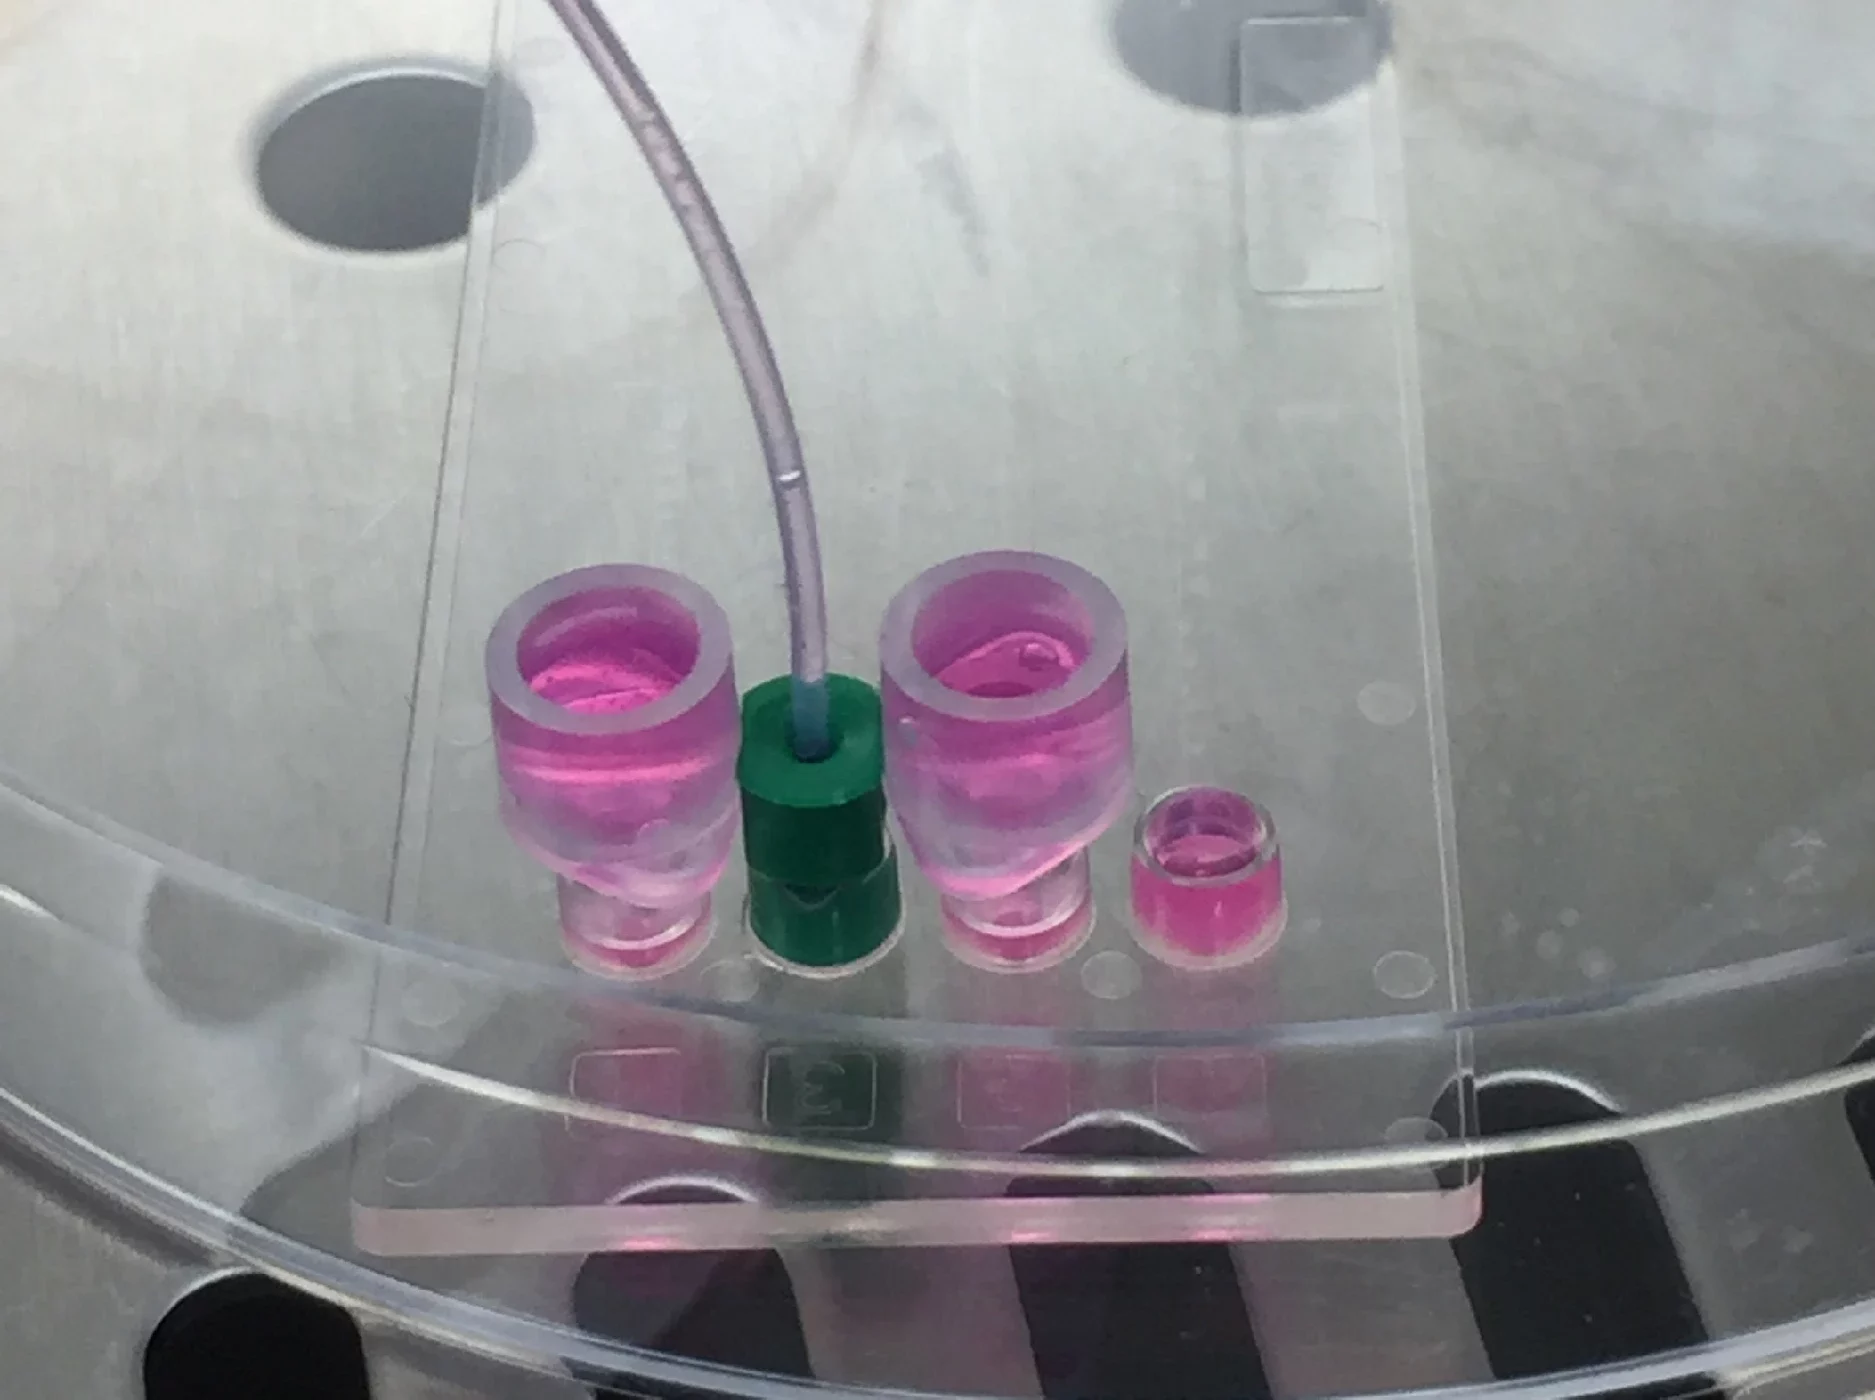
To ensure channels do not dry out during incubation, especially important if the selected chip uses Mini Luer interfaces, connect Mini Luer to Luer connectors at the inlets/ outlets and fill with warmed medium. Keep the chip in a petri dish with lid closed to maintain sterility. Alternatively, a short piece of filled tubing can be attached directly (left), or larger liquid tanks can be attached (right).
Solution preparation
1. Prepare 30 mL of DMEM with 0.5% FBS, 1% Penicillin/ Streptomycin.
2. Fill three falcon tubes with 20 mL, 6 mL and 3 mL of medium.
Setup preparation
1. Connect the reservoir caps to the OB1 with pneumatic tubing.
2. Connect each reservoir to one flow sensor with 1/32” ID tubing. Add 25 cm of 65 μm ID microfluidic resistance to the outlet of the MFS2 flow sensors (i.e. the lines selected for low flow rates, 1 and 2 μl/min) and 15 cm to the MFS3 flow sensor (i.e. line selected for higher flow rate, 10 μl/min).
3. Connect each end of the microfluidic resistance to 1/32” ID tubing using a union connector.
4. Connect the free ends of the 1/32” ID tubing to Luer fittings (they will be connected to the inlet of the chip).
5. Connect three pieces of 1/32” ID tubing to the central inlet of the three MUX Distribution and add Luer fittings to the other end (they will be connected to the outlet of the chip).
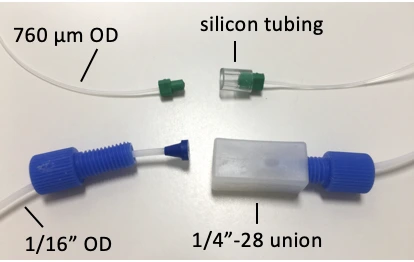
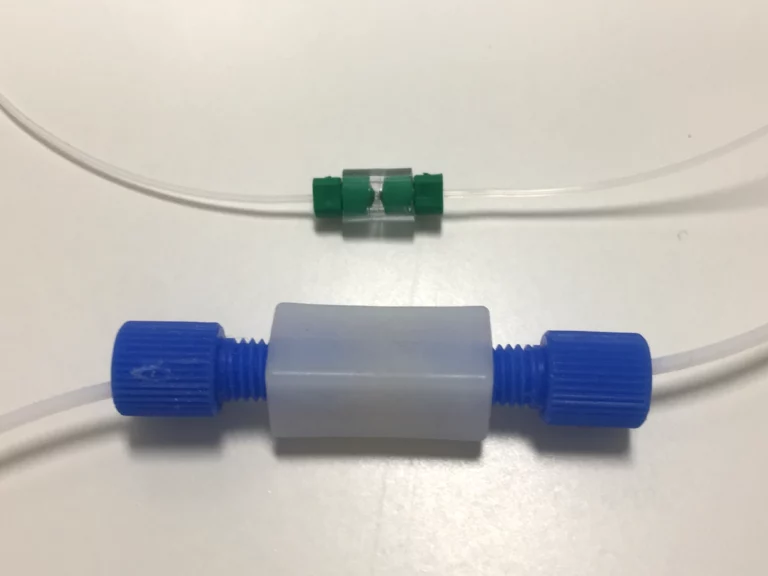
Example union connectors in place of a chip during purging: connect a ¼”-28 threaded union if using 1/16” OD tubing, or a short piece of silicon or tygon tubing/ sleeve if using 760 μm OD tubing and Mini Luers.
6. Cut 36 pieces of tubing and connect one to each outlet of the three MUX Distribution (12 each).
7. Place 36 Eppendorf tubes in a rack and secure the free ends of the tubing to the Eppendorf tubes.
Automated sample collection experiment
1. Connect the reservoirs to the system and purge the lines until a droplet comes out one of the outlets of each MUX (the chip is not attached yet).
2. When all the lines are full of medium turn off the OB1 and connect the chip.
3. In the ESI home window select the sequence button and create a sequence:
- OB1 ON to perfuse 3 channels with 1, 2 and 10 μl/min.
- Select MUX-Distribution positions starting from position 1 for 2 h to collect samples. Repeat for each position up to position 12.
- OB1 OFF to stop flow.
4. Run the sequence.
5. Analyze the data.
Results
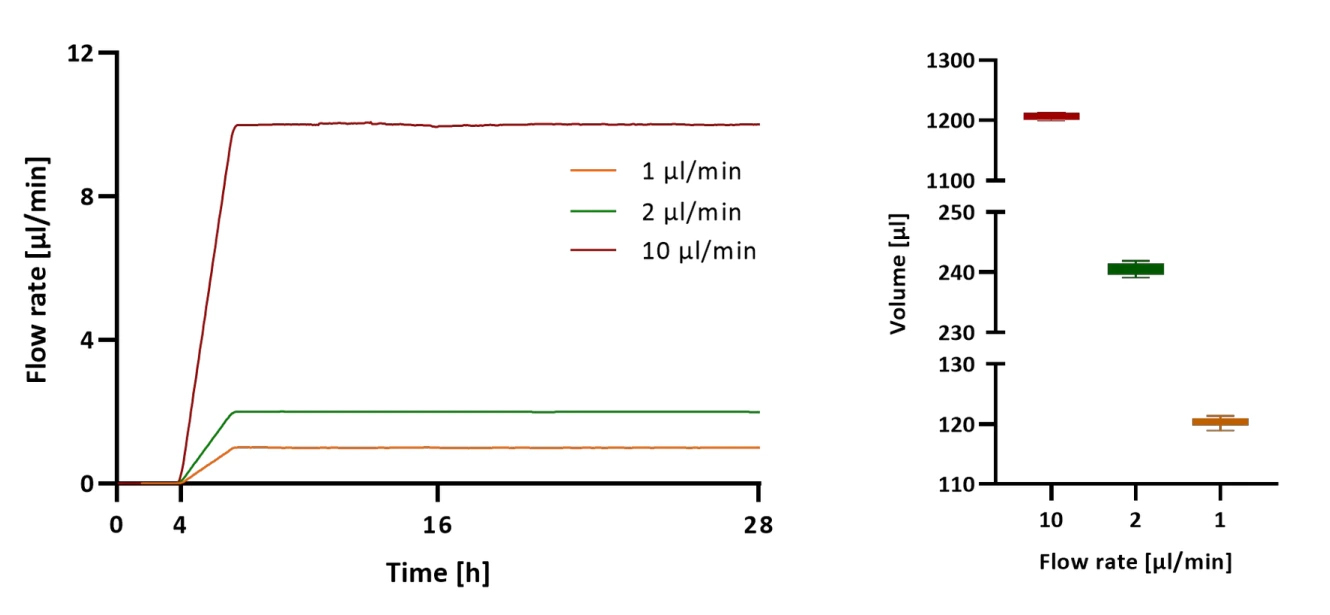
Microglia cells were perfused at three different flow rates for 24 h and medium was collected continually at the outlet of the chip in 2 h intervals. The volume in each vial was weighed and demonstrated good reproducibility for automated sample collection (Figure 1).
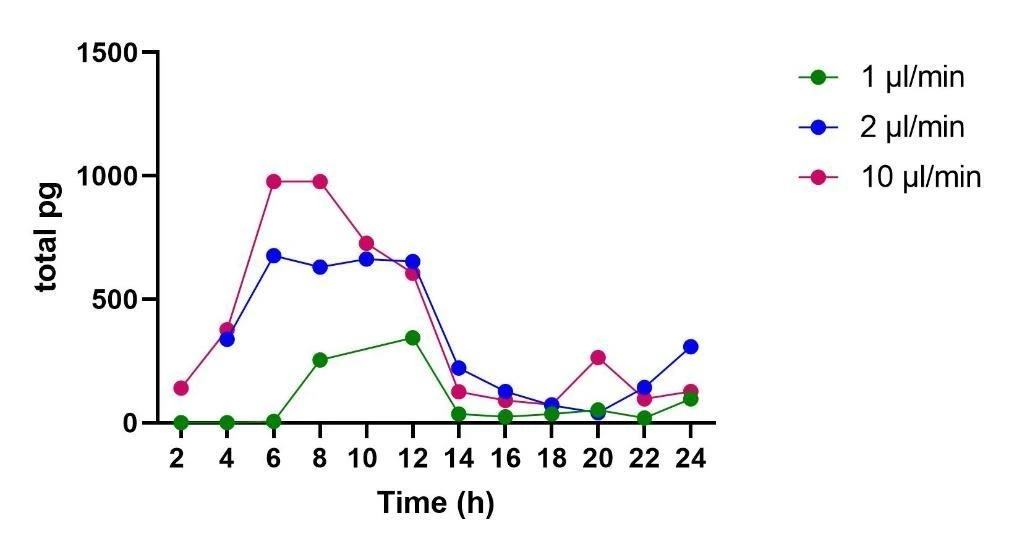
The release of TNF-α was quantified with an ELISA. The trend of release over time was normalized to the total volume collected during each 2 h fraction (Figure 2). The highest amount of TNF-α release was observed using a flow rate of 10 μl/min reaching a maximum of 1000 pg after 6 h of perfusion, followed by 2 μl/min reaching 700 pg at 6 h, and lastly, after 12 h of perfusion at 1 μl/min the cells released a maximum of 400 pg of TNF-α.
More tips included in the Application Note PDF!


Acknowledgments
This application note is part of a project that has received funding from
the European Union’s Horizon 2020 research and innovation program under grant agreement no. 860954 (NeuroTrans),
the French National Research Agency (ANR) and the German Federal Ministry of Education and Research (BMBF) in the frame of the 1st German-French Joint Call for proposals on Artificial Intelligence (LOCAI).
This application note was written by Lisa Muiznieks, PhD, and Francesca Romana Brugnoli, PhD.
Contact: Partnership[at]microfluidic.fr
Check the other Application Notes
FAQ - Automated sample collection
What makes pressure-driven flow suitable here?
Faster response times come with precise control, yet stability matters most when handling tiny volumes during separation steps. One channel runs at one microliter per minute, another at 2, and a third at 10 – each managed separately by an OB1 MK4 unit on the same device. Samples move forward in parallel, guided steadily through without overlap. Collection shifts to fresh tubes rhythmically, timed to match output cycles.
Which components are present in the tested configuration?
A single pressure controller – model OB1 MK4, equipped with three channels covering 0 to 2000 mbar – forms the core. Flow is monitored using inline sensors: two MFS2 units handle lower rates, while an MFS3 manages higher volumes. Routing relies on three 12-port MUX distribution valves, enabling access to 36 distinct pathways during a single automated run. Narrow tubing, with an inner diameter of just 1/32 inch, links components with minimal dead volume. Precise fluid resistance comes from calibrated capillaries: 65 micrometers wide, set at 25 centimeters for lines running at 1 to 2 microliters per minute, and at 15 centimeters for the 10 microliters-per-minute path. All streams feed into a multi-channel microfluidic chip where manipulation occurs.
What shape did the chip have, yet why is that significant?
A single chip, model Fluidic 138, holds four long channels running side by side. Each measures 58.5 millimeters in length, one full millimeter across, and 2-tenths of a millimeter deep, built in Topas material. Because these paths are broad and deep relative to typical designs, introducing cells is easier while avoiding high stress at gentle flow rates. Although this version uses four lanes, similar chips can support more – up to sixteen – if needed. However, when pushing liquid containing cells through any such device, confirming the vertical spacing within it matters most.
What does the setup of the collection process look like?
Starting at one microliter per minute, the controller maintains a steady flow, then increases to 2 microliters per minute, then to 10 microliters per minute. Every two hours, the MUX valves shift position, guiding fluid into new channels. A full day of operation produces twelve collected samples per flow rate. That makes thirty-six separate fractions overall. The volume per segment closely matches the intended value. Twelve hundred microliters gather at the highest rate during each interval. At the lowest setting, around 120 microliters collect. Two hundred forty is typical when running at twice the base speed.
How did the living systems respond? What patterns emerged over time?
TNF-α release from microglia increased with flow rate, consistent with mechanosensitive activation (Piezo1). Peak amounts (per 2-hour fraction) occurred around 6 hours for the two faster conditions: roughly 1000 pg at 10 µL/min and ~700 pg at 2 µL/min; at 1 µL/min, the maximum was ~400 pg after about 12 hours. Concentrations were normalized to the actual volume collected for each fraction.
Could there be parts of the control loop still useful to retain?
Flow control P, along with I, reached equilibrium at 0.001, promoting gentle conditions suitable for delicate cells. Verification of the actual versus intended flow is performed through inline sensors. When smoother output is required, applying a brief moving average (5-10 seconds) to the sensor data reduces minor fluctuations while preserving genuine changes in signal shape.
How little effort on the bench is required to ensure proper sterile seeding?
Starting with hydrophilic surfaces makes things easier, though standard coatings work too. A cell suspension at 0.5-1 × 10^6 cells/mL should be fully dispersed before loading. Flow it slowly into the channels using Mini Luer ports to avoid damage. For proper adhesion, incubate for 4 to 16 hours. Throughout this time, maintain fluid levels at both ends with warmed medium. Small reservoirs or short tubes can stop the openings from drying out.
What method reduces leftover parts when working with fractions?
To keep things clean, fit short, inflexible tubes leading straight to the collector. Position the nozzle directly over every tube axis. After each advance, add a quick priming burst that clears fluid trapped in the tip. Well-organized piping helps reduce leftover traces down to just one or two percent of the dispensed amount. Confirm results using fluorescein in a stepwise fashion, then record how quickly the signal moves from 10% to 90%.
How much output should one expect when detailing procedures?
Measurements show the channel size to be 58.5 by 1.0 by 0.2 millimeters. Flow rates were fixed at 1, 2, and then 10 microliters per minute. Each sample remained in place for 2 hours before moving on. Collected volume reached 120, 240, up to 1200 microliters across runs. Controller settings used a proportional gain of 0.001 and an integral term of 0.001. Two MFS2 sensors plus one MFS3 monitored flow during tests. Tubing resistance came from capillaries with an inner diameter of 65 microns and lengths of 25 and 15 centimeters; twelve fractions are formed along each output line within a full day. In testing, TNF-alpha levels rose within each collection window. Peak concentration times followed earlier observations.
What are the main day-1 failure modes – and the fixes?
-A gentle current shift? Try cutting down flexible piping, then go over obstruction distances carefully. Finally, verify the control unit settings match expected values.
-Bubble formation during incubation can be reduced by warming the fluid beforehand. The liquid should also undergo degassing to minimize gas release later. A barrier made of water-repelling material, placed before entry into the chamber, helps capture bubbles early.
-When mis-indexing occurs after extended idle periods, begin by returning the MUX units to their original positions before starting operations. Realign them at regular intervals throughout the process flow.
-A slight deviation in fraction volume – more than 5%- calls for weighing several vials while timing their collection. When discrepancies appear, changes to flow calibration may be necessary. Adjusting dwell time can improve delivery accuracy. Precision improves when measured responses follow observed variance.
Where does the Microfluidics Innovation Center fit for grants and prototypes?
One way to look at the Microfluidics Innovation Center is through its role in grant applications and prototype development. Starting from initial concepts, MIC builds complete fractionation systems – handling chip design, fluid routing, automation logic, and measurement integration – before moving into fabrication of tailored microfluidic devices and delivering functional prototypes. As a specialized R&D company participating in European research collaborations, we often see significantly higher approval rates than the average submission outcome. This effect comes from joint drafting of experimental approaches, verification strategies, and commercialization frameworks, along with full responsibility taken for the microsystem engineering components.
Can the same approach scale to multi-condition or higher throughput screens??
Yes. Using chips that support multiple channels – anywhere from four to sixteen – and coordinated MUX banks allows for switching between different flow speeds, signals, or types of cells. When running at a two-hour interval and a rate of 10 microliters per minute, a single channel produces twelve times 1200 microliters daily. By running several channels together or reducing the time spent on each step, for instance, cutting it down to half or one hour, the total output decreases while gaining finer detail over time.
Small quality-of-life tips that help downstream analysis
Start each label with the exact time, followed by the fraction number. Record target values together with actual flow rates observed. Save the space between the chip exit and the collection tube – this gap affects timing accuracy later. When adjusting the media mix or heat during operation, factor in the altered fluid thickness. Then update control settings to match those shifts smoothly.