Viscous liquid flow rate measurement
Authors
Yuwei Liu
Mukesh Kumar Sivakumar
Lisa Muiznieks, PhD
Publication Date
April 24, 2025
Keywords
Viscous liquid
Flow sensor
Flow rate measurement
Need advice for your flow rate measurement?
Your microfluidic SME partner for Horizon Europe
We take care of microfluidic engineering, work on valorization and optimize the proposal with you
Introduction
In microfluidic systems, the viscosity of working fluids is a key parameter that influences flow behavior. At the microscale, inertial forces are negligible (low Reynolds number regime), and viscous forces dominate the flow dynamics. As a result, fluid viscosity directly affects flow rate and shear stress distributions within microchannels and pressure drops across microfluidic setups. This can influence the overall stability of the flow and efficiency of microfluidic processes (mixing, separation, particle focusing, etc), affecting inflow particle detection and droplet formation, highlighting the need for accurate flow rate measurements for applications involving viscous liquids.
Our new Galileo flow rate sensor comes calibrated for use with a range of liquids of different viscosities, suitable for applications requiring measurement and/or control of viscous liquid flow rates. The Galileo flow rate sensor is designed with a base and snap-in cartridge. The flow path is contained entirely within the cartridge, which can be swapped to measure different flow rate ranges, or when it is important to avoid cross-contamination between experiments. Our sensor also features a unique clogging alert light to notify the user that the measurement reading is drifting or if the sensor is fully blocked.
This application note demonstrates the technical performance of our Galileo flow sensor with viscous liquids at flow rates of 0.5-50 µL/min, assessed by gravimetric analysis. Glycerol was selected as a test liquid due to its well-characterized and easily tunable viscosity. Here, we tested the Galileo flow sensor with dilutions of 20-80% (v/v) glycerol in water. Hexadecane was also tested as its viscosity closely matches that of glycerol 40%. Glycerol 40% approximates the viscosity of whole blood (commonly reported in the range of 3.5-5.5 mPa.s [1]), making it an option to control particles in suspension, while hexadecane has applications in emulsion formation.
Applications
Microfluidic applications of the Galileo flow rate sensor for viscous liquid flow rate measurements include:
- Flow focusing (e.g. for imaging flow cytometry)
- Droplet formation and stability (e.g. cell encapsulation, single or double emulsions, nanoparticle formation)
- Cell or particle manipulation
- Controlled mixing
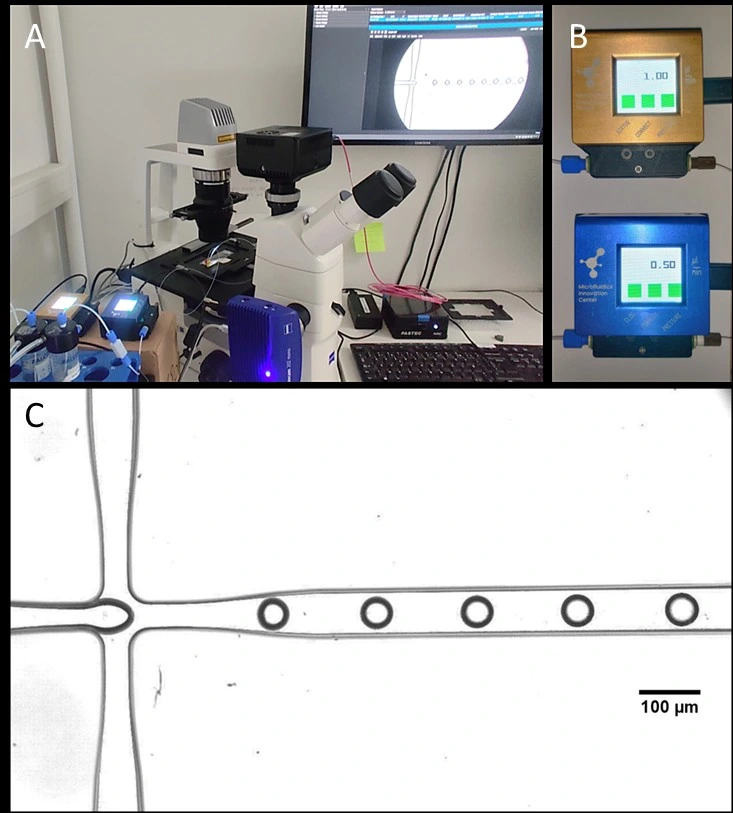
Setup
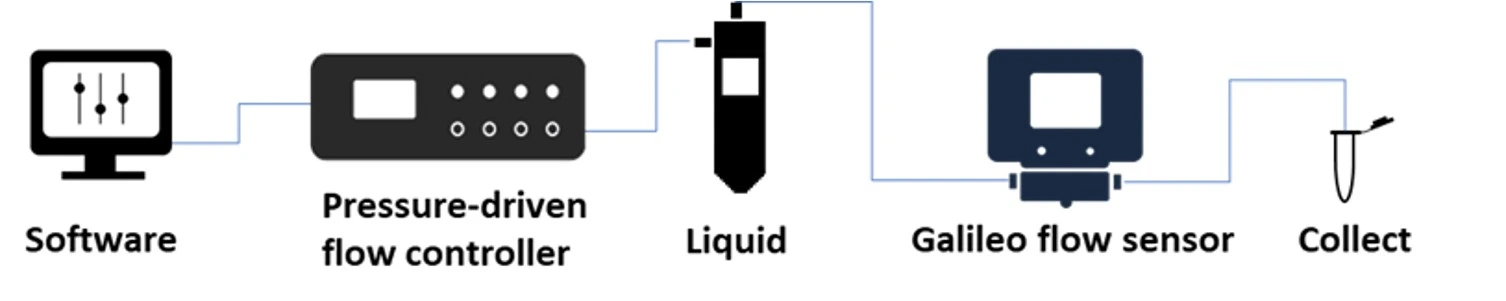
In this setup, a pressure-driven flow controller was used to drive liquids of different viscosities through a microfluidic setup. The Galileo flow rate sensor was connected inline to monitor the flow continuously. An Eppendorf tube was placed at the outlet to collect the liquid for analysis.
Materials
Hardware:
- Flow controller (e.g. pressure-driven OB1 MK4 with one 0-2000 mbar channel, Elveflow)
- Galileo flow rate sensor (0-30 µL/min and 0-480 µL/min cartridges; Note: other ranges are available)
- Tubings (PTFE, 1/16” outer diameter; OD), fittings and reservoirs
- Scale (Mettler Toledo XSR225)
Chemicals:
- Glycerol dilutions (20%, 40%, 60% and 80% v/v in water)
- Hexadecane
Quick start guide
Instrument connection
1. Connect a pressure-driven flow controller to an external pressure supply using pneumatic tubing, and to a computer.
2. Turn on the pressure controller and open the software.
3. Install and calibrate the pressure controller following the manufacturer’s instructions.
4. Click the Galileo flow sensor cartridge into its base.
5. Connect the Galileo base to a computer (USB type C-to-type C or USB type C-to-type 2). Open the Galileo software and click “Connect Galileo” on the interface.
6. Select the working liquid from the dropdown menu and click “Apply”.
Setup preparation and filling
1. Connect the liquid reservoir caps to the pressure controller with pneumatic tubing.
2. Connect the reservoir to the Galileo flow sensor cartridge inlet with 1/16” OD tubing.
3. Connect a collection vial to the end of the setup, e.g. Eppendorf tube.
4. Fill the system until liquid reaches the outlet of the tubing connected to the Eppendorf vial. Note, the Galileo flow rate sensor should be used with a maximum pressure of 3 bar. A pressure alert light is visible on the sensor display; red indicates an over-pressure event.
Experiment
Gravimetric analysis provides a direct measurement of flow by tracking mass accumulation over time, making it particularly useful for benchmarking flow performance in microfluidic setups.
Each Galileo flow sensor test was performed for a one-hour collection period. The total mass of the collected liquid was determined by weighing the collection reservoir before and after liquid collection. Mass was converted to volume using equation 1.
Equation 1: density = mass / volume
Flow measurement by gravimetric analysis
1. Start the flow by adjusting the pressure to reach the target flow rate. Flow for 3-5 minutes to ensure the system is stable.
2. Click “Start Acquisition” in the Galileo software, and select a location and name for the log file.
3. Start timing the flow rate: simultaneously read the exact starting weight of the reservoir on the precision balance and start a timer. Also note the precise real time to cross-reference with the flow sensor log file during analysis.
4. Continue to flow for desired time, e.g. 1 h. Simultaneously stop the flow and the timer.
5. Click “Stop acquisition” in the Galileo software.
6. Weigh the full reservoir on the precision balance and record the value.
7. Clean the system thoroughly by flushing with water, then ethanol and air. Store the Galileo flow sensor dry when not in use.
Download the MIC Horizon Europe 2026/2027 Calls Calendar:
Results
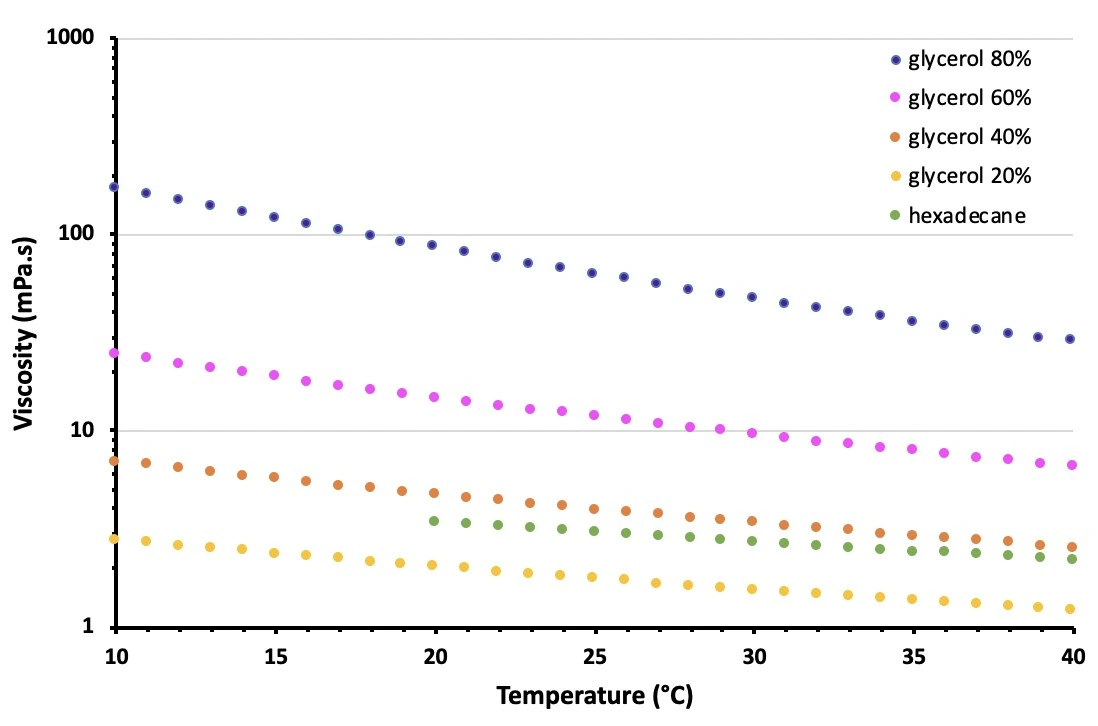
Viscosity of liquids tested in this application note
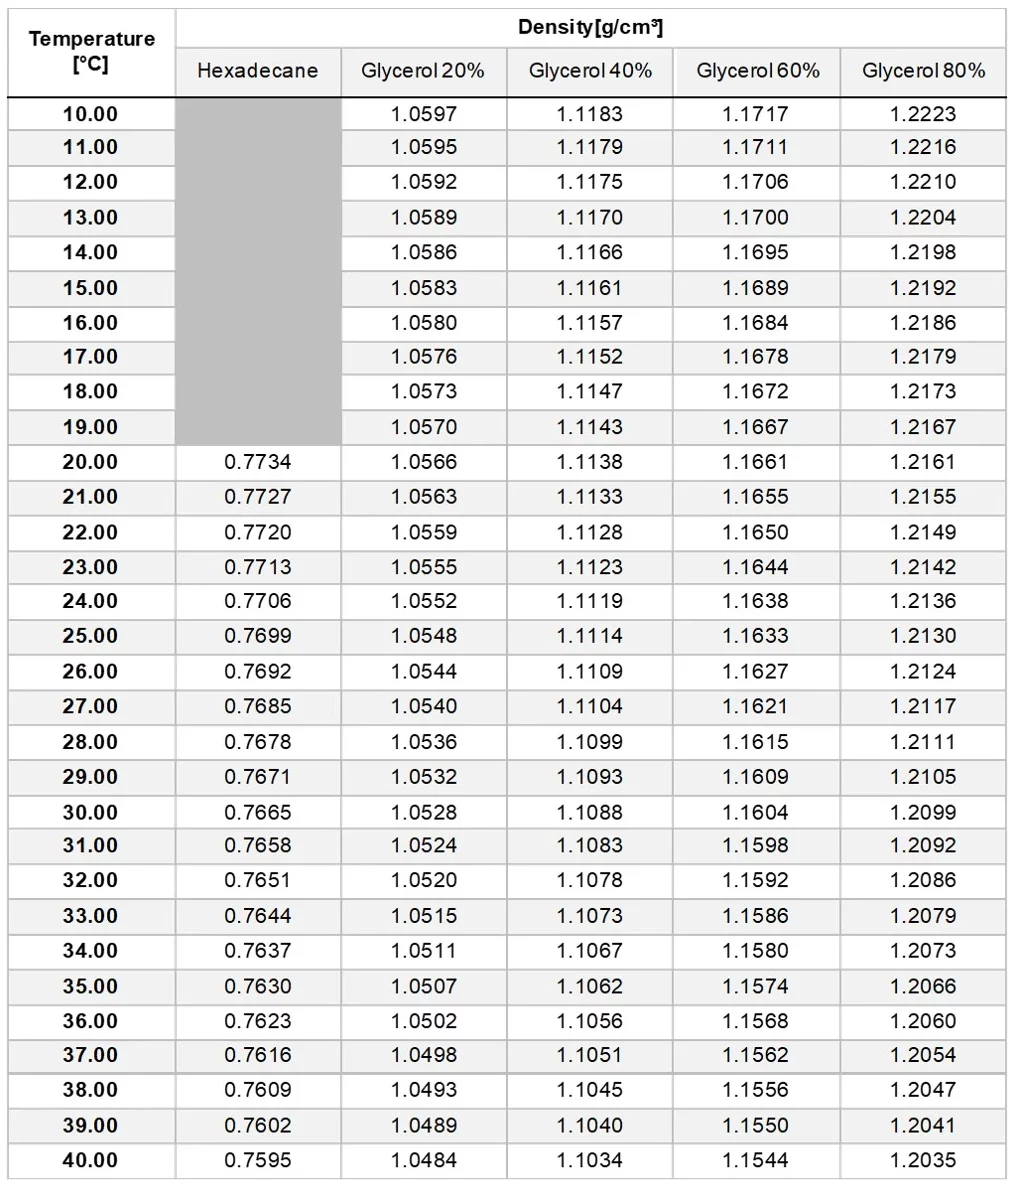
The Galileo flow rate sensor was programmed during manufacture with viscosity data for different liquids (measured using a Lovis 2000 ME rolling and falling ball viscometer, Anton Paar, between 10-40°C), and the liquid names were added to the dropdown menu in the software interface. Viscosities of the test fluids used in this experiment are shown graphically (Fig. 1), while detailed viscosity and density values are also given in Tables 1 and 2 (Appendix 1).
Flow sensor performance with viscous liquids
The Galileo flow sensor was tested for accuracy with liquids of different viscosities using two Galileo cartridges of ranges 0-30 µL/min (Galileo-1) and 0-480 µL/min (Galileo-2), where the full working range is defined for pure water. Galileo-1 was tested here at flow rates of 0.5, 2.5 and 10 µL/min. Galileo-2 was tested at flow rates of 10, 20 and 50 µL/min. The accuracy of the Galileo flow rate sensor with viscous liquids in the flow rate range of 0.5-50 µL/min was determined using the gravimetric method (Fig. 2, 3). Accuracy is presented as the percent difference of the calculated average flow rate from the expected flow rate provided by the sensor.
The average flow rate was calculated from the measured liquid mass, corrected for average fluid density, over the given collection time. The average fluid density per test was calculed, accounting for temperature. The expected flow rate was determined by averaging the instantaneous flow rate readings from the Galileo flow rate sensor.
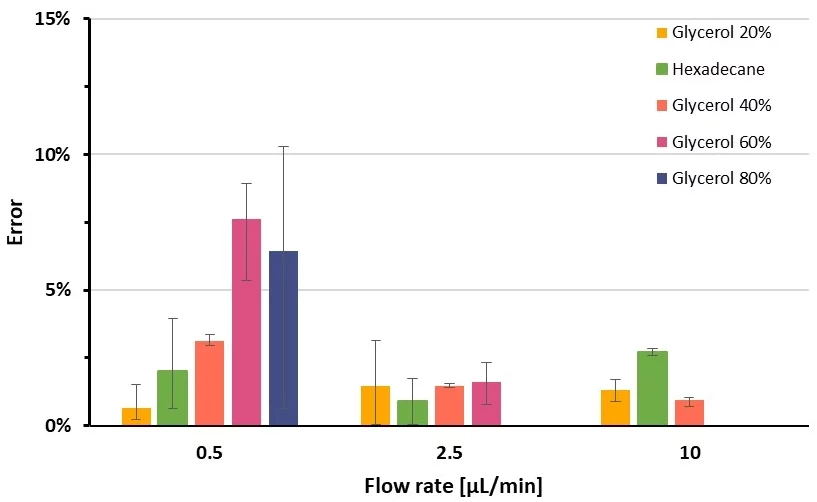
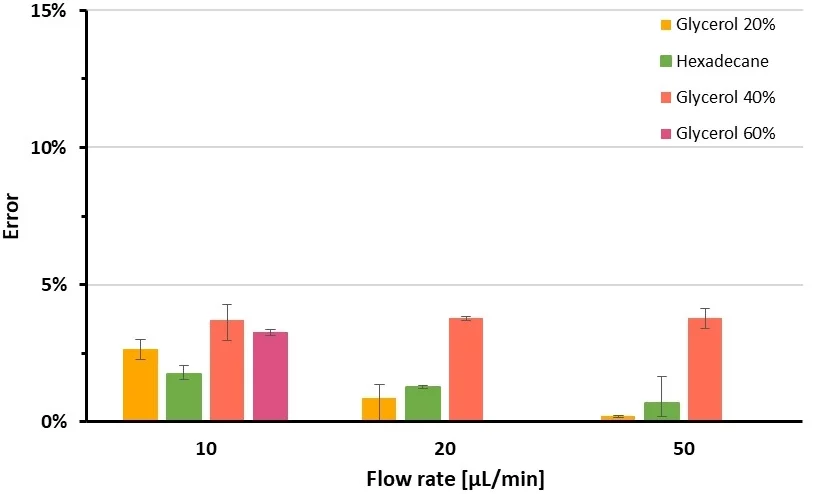
The Galileo flow rate sensor performed reliably for a variety of viscous liquids. Specifically, flow rate measurement error was within 5% across flow rates of 0.5-50 µL/min for viscous liquids in the range of 2-5 mPa·s, and within 10% error for substantially more viscous liquids at the lowest flow rates tested per cartridge, making the Galileo flow sensor a suitable option for use in microfluidic applications utilizing viscous liquids.
Use-case application of viscous liquid flow rate measurement
An application of viscous liquid flow rate measurement and/or control is shown for microfluidic droplet generation (Figure 4). In this setup, water-in-oil (W/O) droplets were generated using hexadecane as the continuous phase and water as the dispersed phase, within a cross-junction microfluidic channel.
Appendix 1
Table 1. Viscosity of liquids tested in this application note (Instrument uncertainty 0.5%).
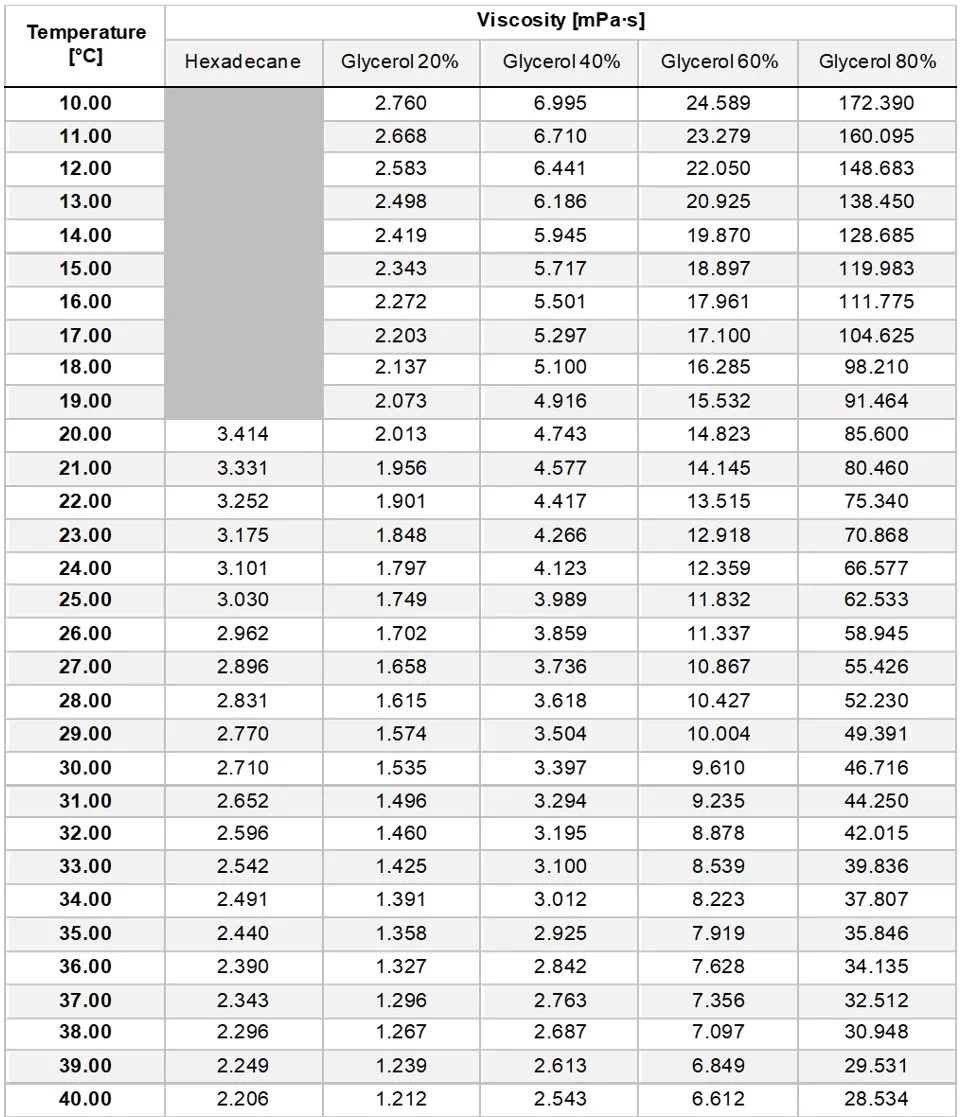
Table 2. Density of liquids tested in this application note.
Reference
[1] Nader, E. et al. Front Physiol. (2019) 10:1329. doi: 10.3389/fphys.2019.01329
More tips included in the Application Note PDF!


Acknowledgements
This application note has received funding from the European Union’s Horizon research and innovation program under projects:
HORIZON-EIC-2022-TRANSITION-01, grant agreement no. 101113098 (Galileo),
HORIZON-MSCA-2022-DN-01, grant agreement no. 101119729 (NEXTSCREEN),
and HORIZON-MSCA-2022-DN-01, grant agreement no. 101119956 (DarChemDN).
This application note was written by
Yuwei Liu, PhD candidate, Mukesh Kumar Sivakumar, PhD candidate & Lisa Muiznieks, PhD.
Published on April 2025
Contact: Partnership[at]microfluidic.fr


Check the other Application Notes
FAQ - Viscous Liquid Flow Rate Measurement
Simply put, what issue does this document tackle?
Pushing thick fluids through tiny channels means even minor flow mistakes can disrupt mixing, alter droplet formation, or shift particle positions unpredictably. This document explains a method for monitoring and instantly adjusting slow flows of such liquids using the Galileo inline sensor. With this setup, the actual results closely align with the predicted behavior. Measurement becomes part of the process, not an afterthought.
What does the layout of the test configuration look like?
A setup built around simplicity powers fluid movement through pressure control; following that, a Galileo flow sensor takes readings directly in the line. From there, output flows into either a collection tube or reservoir – ready for weight checks or further examination down the path. Nothing more. What stands out is constant in-line tracking rather than waiting until the very end to measure, providing clear sight into shifts, blockages, or irregular pulses.
How fast does the system move fluid?
The note reports stable measurement and control over a range of roughly 0.5 to 50 µL/min with viscous test liquids. That range comfortably covers many droplet-generation, encapsulation, and microparticle workflows that operate in the single- to double-digit µL/min range.
What happens when viscosity varies in Galileo?
Pre-calibrated across multiple viscosity levels, the device works with disposable cartridges snapped into place. Fluid flows solely within the cartridge interior, allowing quick swaps – either for new flow targets or to prevent mix-ups between formulas. This design eliminates the need to reconfigure plumbing whenever viscosity or operating range changes.
Yet small blockages and gradual slowdowns often escape attention.
Ahead of failure, visibility matters. The system shows fluid movement as it happens – making small shifts obvious at a glance. When something changes, like buildup or uneven flow, a built-in signal lights up without delay. Instead of missing slow problems, users spot them early. Under thick-flow conditions, this feature prevents silent breakdowns from ruining results.
What kinds of programs gain the greatest advantage?
Fine changes in flow rate matter most when handling fluids that react to stress or thickness shifts – examples include making emulsion drops, crafting nanoparticles, guiding cells or beads, pushing fluid across membranes, or blending substances under control. For such tasks, maintaining a steady flow of 1 to 2 microliters per minute often determines whether results are consistent or completely off.
What role do cartridges play in maintaining cleanliness and preventing contamination?
Because the liquid route remains inside the cartridge, assign one unit to sterile or protein-rich samples, while using a separate unit for solvents or fluids rich in glycerol. Switching between them requires only moments; meanwhile, leftover residue from thick liquids becomes far less likely. In environments under strict oversight, tracking across batches becomes easier – each cartridge serves as a distinct, swappable part.
Is it possible to complete the circuit for automatic regulation?
Yes. The workflow favors pressure-driven actuation precisely because it responds quickly and smoothly to measured flow. In most labs, you’ll run Galileo’s live signal into your control software, adjust upstream pressure to hold a setpoint (e.g., 8.0 µL/min), and log both commanded pressure and measured flow for reproducibility. If you later switch to a higher-viscosity formulation, you keep the same logic – only the pressure, flow mapping moves.
What happens when comparing it to syringe-pump measurements of thick fluids?
It turns out syringe pumps display what they aim for, not what actually flows through the microfluidic channel. Viscosity changes, flexible tubing, temperature shifts, and downstream resistance often mean reality falls short of the set value. Measurement right inside the fluid path – like the one pictured – shows exactly what moves where, including any pulses hiding beneath steady averages. This kind of monitoring enables immediate adjustments, which explains its role here despite highly calibrated driving systems already in place.
What calibration and performance details matter for reviewers?
Two things usually satisfy peer reviewers and QA teams: a viscosity-aware calibration (so the scale doesn’t silently shift when you move from aqueous to viscous media) and a documented, cartridge-specific flow range. The application note explicitly focuses on viscous liquids and low-flow operation (down to about 0.5 µL/min), with cartridge swaps to adapt the range and prevent cross-contamination. It’s a pragmatic approach to traceability without over-engineering the rig.
Where does the Microfluidics Innovation Center fit in if we plan a Horizon Europe project or need a prototype?
Home to practical solutions when microfluidics meet real-world demands, the Microfluidic Innovation Center steps in during early Horizon Europe planning or when a functional prototype takes shape. Instead of just supplying parts, MIC integrates full systems – sensors, actuators, chips, controls – into one coherent unit. Custom chip fabrication follows, tailored not to ideal conditions but to actual laboratory environments where precision matters. Think durability first; these are devices meant to operate day after day without fail. Often joining EU-funded collaborations as the go-to expert for automation and fluid handling, the center contributes by shaping experimental approaches, selecting measurement tools, and assembling user-ready platforms. Biologists and chemists benefit directly – they interact with robust equipment designed for consistency, not constant troubleshooting. Evidence from earlier grants shows proposals involving MIC clear hurdles at roughly twice the rate expected on paper alone.
What useful ideas rarely show up in research articles?
Some steps help maintain consistency across testing days. Warming thick samples to a steady temperature happens before calibration. Rigid, short tubes connect above the sensor to reduce flex. Alerts about blockages or fluctuations get recorded with exact times. Switching fluid types means swapping cartridges instead of adjusting zero on the old one. Small actions like these link later results back to early baselines.