Perfusion cell culture
Author
Lisa Muiznieks, PhD,
Ilaria Ferraboschi, PhD candidate
Publication Date
Keywords
dynamic culture
cell viability
flow perfusion
nutrient supply
shear control
physiological flow
Need advice for your perfusion cell culture?
Your microfluidic SME partner for Horizon Europe
We take care of microfluidic engineering, work on valorization and optimize the proposal with you
Introduction
Cell culture models are a powerful tool in biomedical research and pharmaceutical development. The ability to mimic physiologically relevant microenvironments is key to improving the clinical relevance of such models and assays. One feature of the in vivo cell environment that is often overlooked in traditional static cultures is the presence of flow and other mechanical stimuli experienced by cells. Microfluidics is a technique that shrinks the cell culture zone to the microscale and provides continuous perfusion of medium (including nutrients exchange and waste removal).
Perfusion cell culture can be achieved by simply flowing medium over cells from a reservoir to a waste collection vessel. However, by connecting the flow path in a loop from the reservoir to the chip and back, referred to as “recirculation”, the experiment won’t stop when the main reservoir is empty, i.e. the experiment length and flow rate are far less dependent on the starting volume of liquid than if a looped circuit is not used. The total volume of the medium in the system is usually many fold larger than the volume of the microfluidic cell culture chamber, meaning that the medium can stay fresh for days to weeks. Recirculation also conditions the medium with molecules secreted by the cells.
Recirculation using a pressure-driven flow controller is based on having two liquid reservoirs that are alternately pressurized so that one reservoir empties while the other collects. This requires a valve system between the reservoirs and the chip to ensure unidirectional flow over the cells. Valves can be active such as a rotary valve or pair of 3/2 valves, or passive such as using a set of check valves (for a detailed overview, check our review comparing different recirculation systems).
In this application note we demonstrate the continuous perfusion over cells in microfluidic culture using a recirculation circuit made from a passive check valve bridge.
Applications
Microfluidic perfusion cell culture using a recirculating flow path has broad applications in:
- Microphysiological systems, organ-on-a-chip
- Molecular transport assays, barrier models
- Cell rolling and adhesion assays (e.g. tumor metastasis)
- Drug screening
Specific advantages of recirculating the medium include the ability to:
- Conserve medium for long experiments or fast flow rates
- Reduce volume of expensive reagents
- Circulate non-adherent cells
- Mimic physiological multi-organ effects upon connecting multi-organ chips
- Mimic physiological residence times of drugs
- Condition medium (enrich for secretions)
Setup
The perfusion cell culture setup presented here uses a bridge made from 4 check valves and 4 T-junctions to enable the flow of medium through the microfluidic chip in a single direction (solid pink arrows), regardless of whether reservoir 1 or reservoir 2 is being pressurized.
Check valves allow liquid to pass in one direction only, in this case, out from the apex of the triangle. When two flow directions are possible at one T-junction, e.g. when liquid enters corner 3, the flow will circulate through the check valve with the lowest counter-pressure (see schematic below).
Liquid flow paths
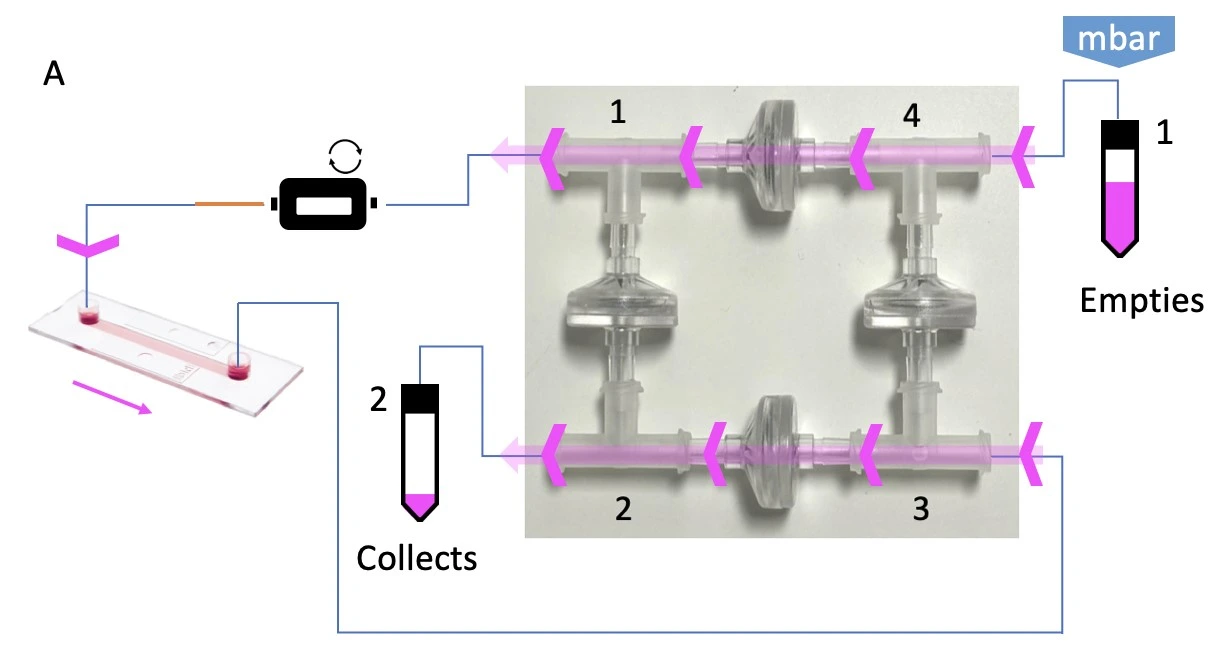
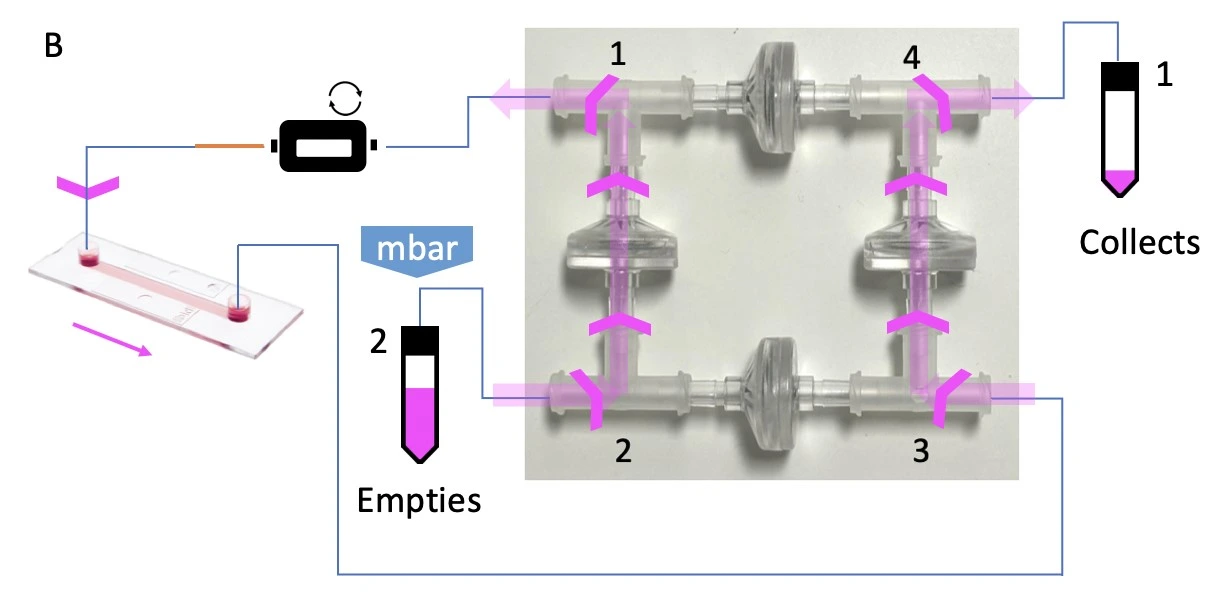
This bridge configuration accommodates two flow paths inside the bridge depending on which reservoir is pressurized (indicated with “mbar”), but only one flow direction through the chip. A. When reservoir 1 is pressurized, liquid is pushed out of the bridge at corner 1 and eventually collects in reservoir 2. B. When reservoir 2 is pressurized, the liquid still exits the bridge at corner 1, maintaining unidirectional flow through the chip, before collecting in reservoir 1.
Download the MIC Horizon Europe 2026/2027 Calls Calendar:
Materials
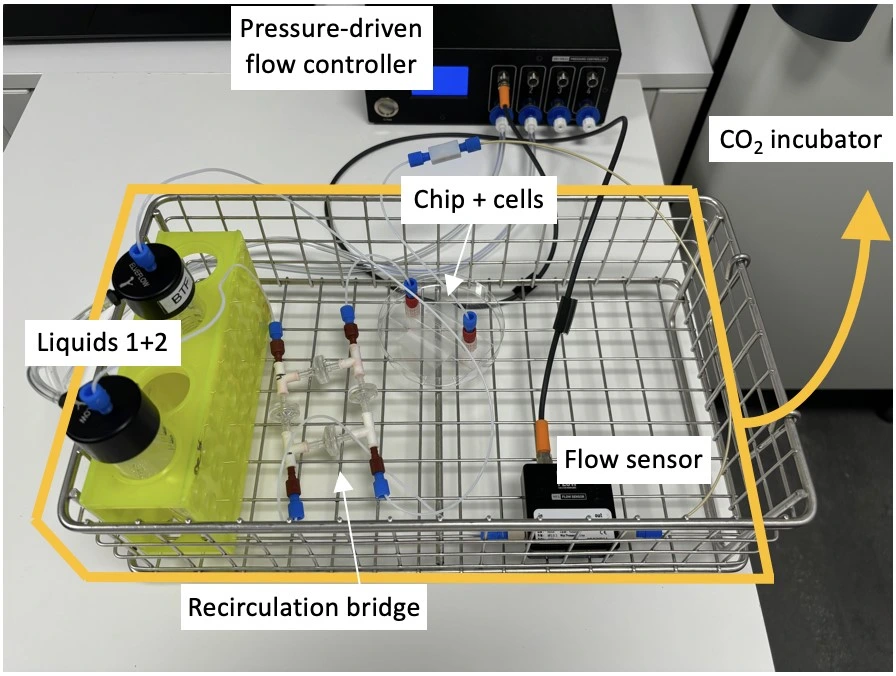
Hardware:
- Pressure-driven flow controller (e.g. OB1 MK4 with two 0-2000 mbar channels; Elveflow)
- Flow sensor (e.g. MFS3+, Elveflow)
- Recirculation bridge for unidirectional flow through the chip (4 X T-junctions, 4 X check valves)
- Tubings (PTFE, 1/16” outer diameter; OD), fittings and reservoirs
- Microfluidic resistance, 40 cm of 175 µm inner diameter (ID)
- Microfluidic chip (e.g. µ-Slide I Luer, ibidi)
Reagents:
- U-251 MG GFP cells (human glioblastoma astrocytoma transfected with GFP; 7.5 ╳ 105 cells/mL)
- Medium (DMEM [+] 4.5g/L D-Glucose; with FBS 10%, penicillin, 100 U/mL / streptomycin, 100 µg/mL)
- Cell stains (propidium iodide, 75 µM)
Design of the chip
The perfusion cell culture experiment used a straight channel chip (µ-Slide I Luer 0.4; ibidi ®). The simple design and large internal geometry of the chip make it straightforward to fill, seed and connect to the circuit. Its polymer coverslip base and microscope slide outer dimensions are ideally adapted for imaging, either as part of an endpoint staining protocol or for live cell imaging to monitor cell proliferation and morphology during perfusion.
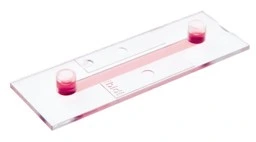
µ-Slide I Luer 0.4 (ibidi ®) | Features |
Interface type | Female Luer |
Chamber volume | 100 µl |
Channel l ✕ w ✕ h | 50 ✕ 5 ✕ 0.4 mm |
Surface treatment | ibiTreat tissue culture treated |
Slide base | #1.5 polymer coverslip |
Quick start guide
Instrument connection
1. Connect a pressure-driven flow controller to an external pressure supply using pneumatic tubing, and to a computer.
2. Turn on the pressure controller and open the software.
3. Install and calibrate the pressure controller following the manufacturer’s instructions.
4. Connect the flow sensors to the pressure controller and software as directed by the manufacturer.
Chip preparation and seeding
1. Prepare the microfluidic chip surface, if needed.
2. Prepare cells as per standard protocol. Disperse all clumps. Count carefully and use immediately.
3. Seed the chip by filling the cell culture chamber with cell suspension. Pay attention to fill only the chamber and not the reservoirs on each side.
4. Wait 5-10 min, then gently fill the reservoirs with fresh medium (containing no cells), taking care not to disturb the cells in the chip.
5. Cover the inlet and outlet and transfer the chip to the CO2 incubator in a sterile petri dish.
6. Leave 6-18h for cells to attach, or as required for your cell type and application.
Recirculation bridge assembly
The recirculation bridge is essential for the perfusion cell culture setup. The bridge is assembled as a square unit from 4 X check valves and 4 X T-junctions. One T-junction is placed at each corner to split the flow and one check valve is placed on each side. The orientation of each valve is crucial for the correct behavior of the system: each pair of parallel valves should be oriented in the same direction.
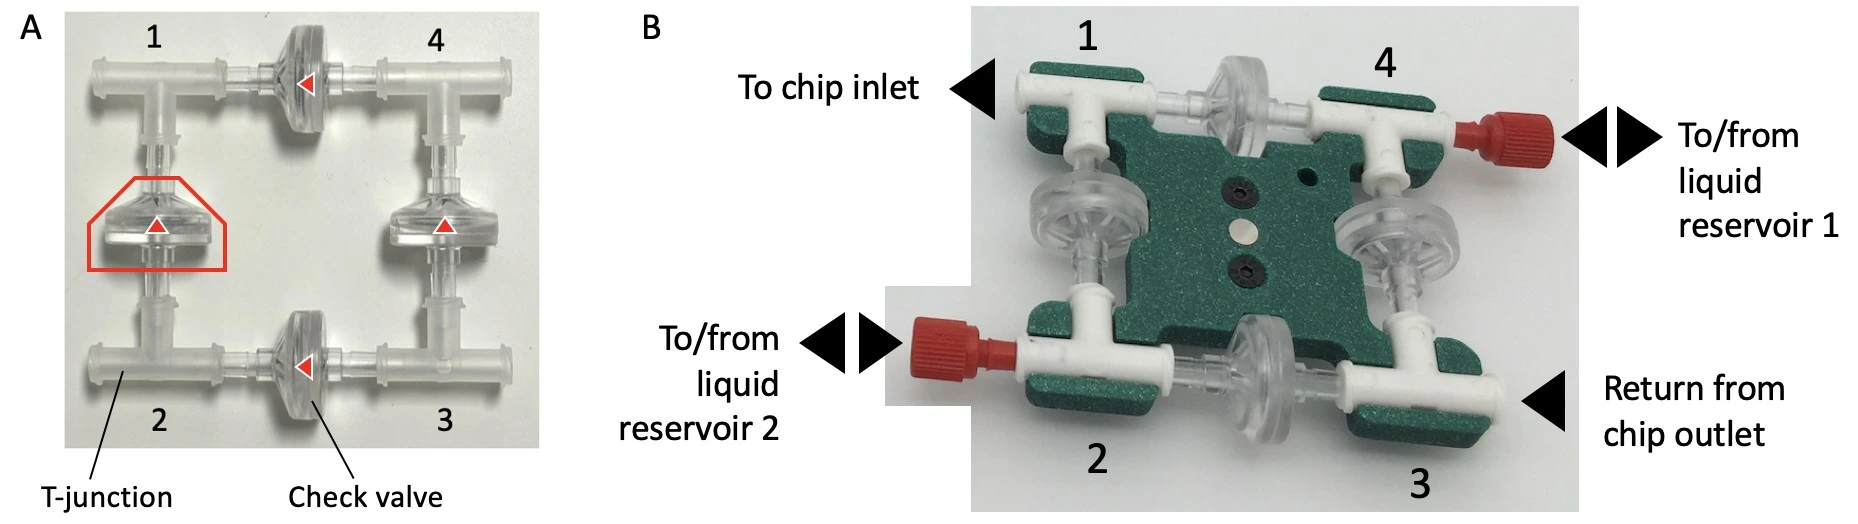
1. Autoclave the check valves and T-junctions. Similarly, cut all lengths of tubing needed to connect the bridge to the fluidic circuit, attach connectors to the ends, and autoclave.
2. Perform steps 2 and 3 in a biosafety cabinet for improved sterility. Connect the check valves between the T-junctions following the orientation shown in the inset of the figure above (see Bridge assembly video- part 1).
3. Firmly press along all 4 axes to tighten the structure. Repeat tightening, if necessary.
Fluidic circuit assembly
1. Connect the reservoir caps to the pressure controller with pneumatic tubing.
2. Connect reservoir 1 to corner 4 of the recirculation bridge using 1/16” OD tubing (see Bridge assembly video- part 2).
3. Connect corner 1 of the recirculation bridge to the flow sensor inlet (see Bridge assembly video- part 2).
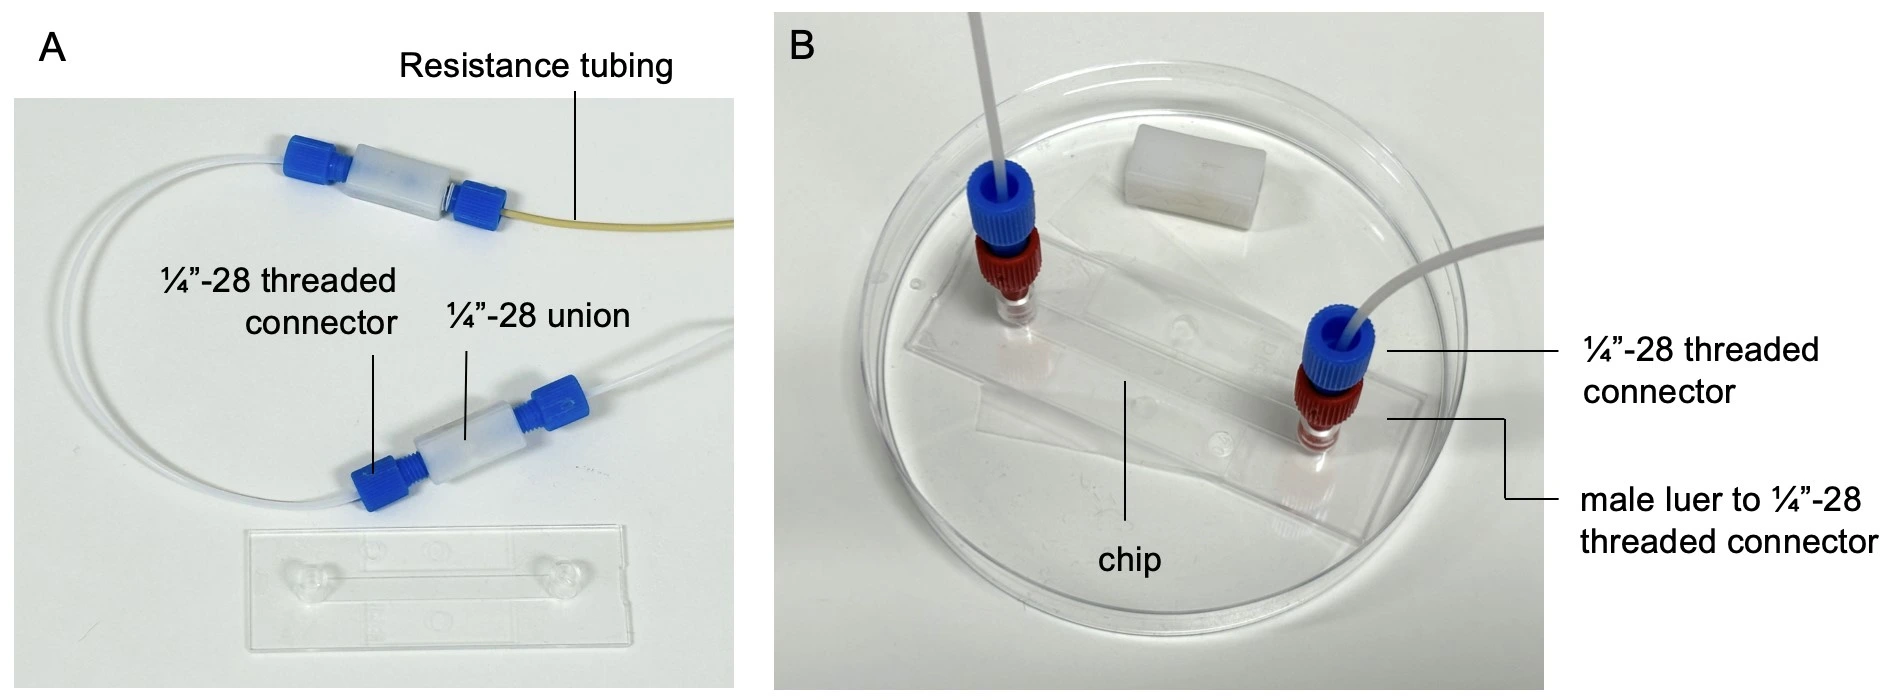
4. Connect 40 cm of 175 µm ID resistance tubing to the outlet of the flow sensor. Use a union connector to then add a length of tubing. This will eventually be connected to the inlet of the microfluidic chip, but for now, add another union connector to the free end.
5. Connect tubing from the union connector (used in place of the chip until the circuit is purged of air) to corner 3 of the recirculation bridge (see Bridge assembly video- part 3).
6. Connect corner 2 of the recirculation bridge to reservoir 2 (see Bridge assembly video- part 2).
Fill the bridge / Purge the circuit
1. Pressurize reservoir 1 to start flow. Hold the bridge with corners 1 and 2 upwards to aid removal of air (see the Bridge Filling video tutorial for more details).
2. When the liquid front has reached reservoir 2, stop pressurizing reservoir 1.
3. Ensure reservoir 2 contains enough liquid, then pressurize reservoir 2 to start flow. Hold the bridge with corners 1 and 4 upwards until the check valve between corners 1 and 2 is filled with liquid.
4. Then tilt the bridge so that corner 4 is pointing upward to remove the remaining air from the circuit.
5. Pressurize alternately reservoir 1 then reservoir 2 a few more times to ensure complete purging of air.
The full bridge filling video
Chip connection
1. Consider performing steps 1-4 in a Biosafety hood to maintain sterility if possible, or to use aseptic conditions on the bench, e.g., bunsen burner. Once the entire circuit is filled with liquid it is time to attach the seeded chip. Ensure the inlet and outlet of the chip are completely filled with medium.
2. Disconnect the union where the chip will be added. Add a ¼”-28 threaded to male Luer connector (red) to the ¼”-28 threaded connector (blue) and start the flow from reservoir 1 at a low flow rate (e.g. 10 µl/min).
3. Wait until a small droplet of liquid is visible from the end of the tubing, then connect it to the chip inlet, touching meniscus to meniscus to avoid trapping any air.
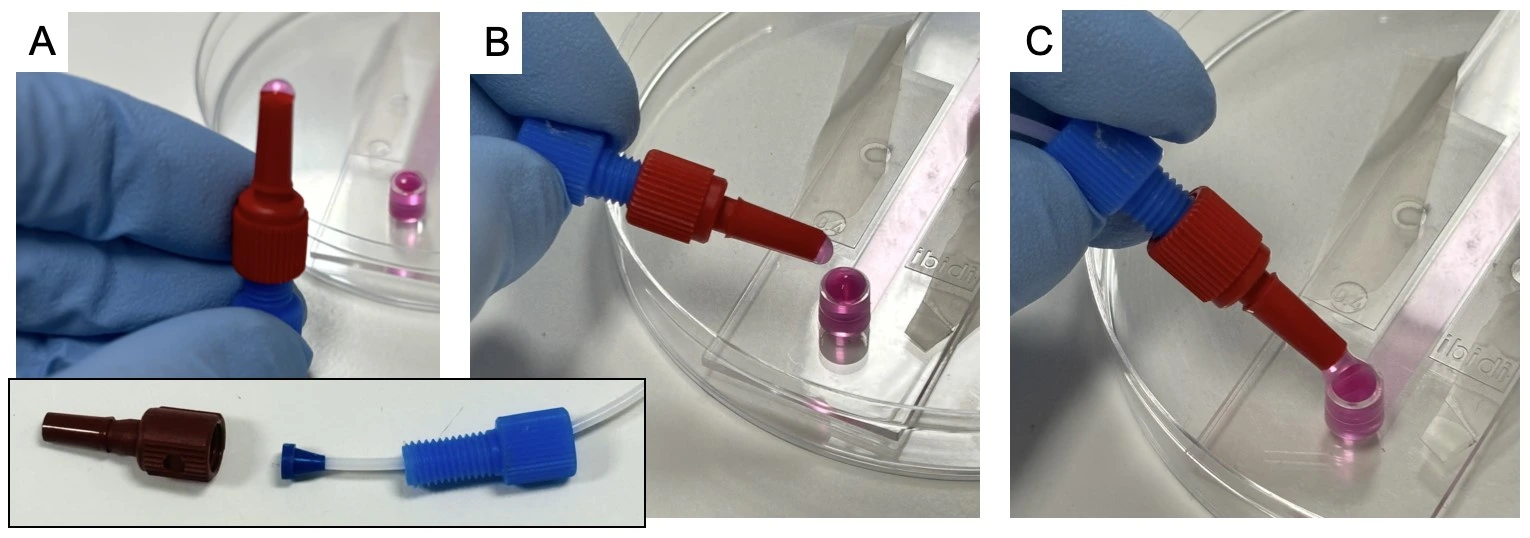
4. Add the free end of tubing to the chip outlet. Carefully wipe up any split liquid.
5. Transfer the setup to the CO2 incubator.
Experiment
1. Schedule liquid recirculation between reservoirs 1 and 2 using the software of the pressure-driven flow controller.
2. Flow at desired flow rate for desired time (e.g., 10 µl/min for 20 h).
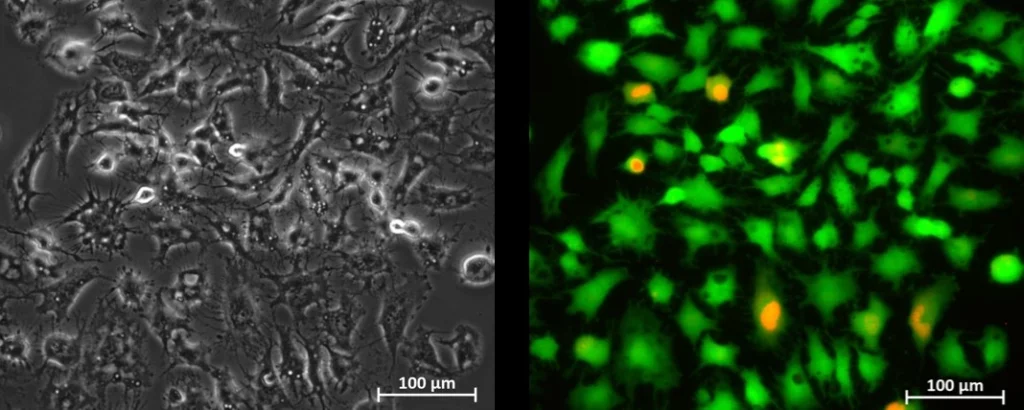
3. Analyze (e.g., image cells in the chip).
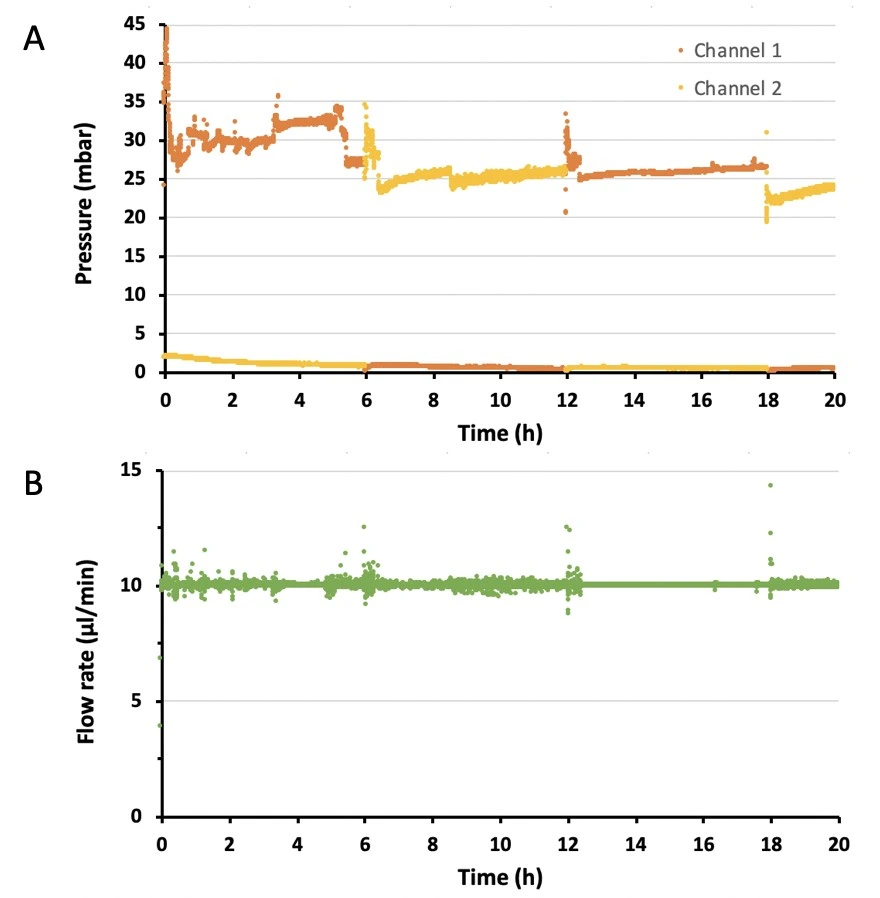
Results
Cells were cultured under constant flow. Medium was recirculated back and forth between 2 reservoirs, while maintaining a single flow direction over cells in the microfluidic chip. Results of the perfusion cell culture experiment are shown in Figures 1 and 2.
The full bridge assembly video
More tips included in the Application Note PDF!

Acknowledgements
This application note was written under funding from the European Union programs:
H2020-MSCA-RISE-2020, grant agreement no. 101007804 (Micro4Nano, project page),
Horizon 2020 research and innovation program H2020-LC-GD-2020-3, grant agreement no. 101036702 (LIFESAVER, project page),
and no. 101037090 (ALTERNATIVE, project page).
This application note was written by Lisa Muiznieks, PhD, and Ilaria Ferraboschi, PhD candidate.
Published in October 2024.
Contact: Partnership[at]microfluidic.fr

Check the other Application Notes
FAQ - Perfusion cell culture
What’s the point of switching from static culture to perfusion in a microfluidic chip?
A steady flow delivers nutrients and oxygen while quickly carrying away waste products. This setup reduces sudden changes in cell conditions compared to standard static cultures. Signaling among cells improves when environmental shifts are minimized. Experiments lasting 24 hours or more tend to stay closer to baseline due to controlled fluid forces.
What does the initial arrangement look like?
Above all, there stands the actuator – either a syringe pump handling steady, sustained flows or a pressure device managing abrupt changes. Nestled in the center lies the chip itself: housing both culture space and connecting pathways, often including a feature to catch bubbles. What follows is either disposal or collection equipment when gathering secreted molecules across intervals. Tight, inflexible tubes combined with an immediate bubble barrier just upstream of the chip frequently separate reliable operation from unstable behavior.
For many mammalian cells, which range of flow rates causes minimal harm?
-Start by converting the flow to wall shear stress based on your specific shape, then pick the target value. Typically, cells adhere well at 0.1-1.0 pascals; several strong cell types can withstand nearly 2 pascals for brief periods. When dealing with rectangular channels where the height is much smaller than the width, a rough approximation works well.
-Shear stress is roughly six times the viscosity multiplied by flow rate, divided by channel width and height squared.
-If viscosity sits around 0.7 to 0.9 millipascal-seconds at body temperature, with a channel height of 100 micrometers, a width of 500 micrometers, plus flow set to 5 microliters per minute, wall shear stress reaches about 0.6 up to 0.9 pascals – often acceptable during extended perfusion sessions.
Syringe pump or pressure control – how do I decide?
When steady delivery over long periods is required, syringe pumps work well after initial adjustments settle. These devices demand little attention once system elasticity is managed. For fast responses – like sudden changes or feedback-driven tasks – pressure systems outperform due to their speed. They adjust within fractions of a second. A calm, unchanging flow, however, leans toward simpler tools. Using wide-bore syringes helps smooth out irregular plunger pulses. Pairing them with rigid tubing further improves stability. Often, that combination strikes the right balance without being overly complex.
What happens to shear if the medium’s makeup shifts or temperature varies?
Temperature and composition affect viscosity. Most water-based fluids lose about 2-4% of their thickness for each degree Celsius rise in temperature. Substances such as blood serum or added polymers may increase viscosity by a factor of 2. For accuracy, one option is to adjust measurements using real-time temperature and mix data. Another approach involves directly recording viscosity, then scaling the flow rate to maintain wall shear stress. When viscosity increases by about 30%, cutting the flow by a similar amount preserves the original shear condition.
Blisters: how to avoid them, what to do when they happen?
Start by degassing the medium before running the system. Warm up the fluidic pathways beforehand. Position a hydrophobic membrane bubble catcher near the device. Use short lengths of gas-permeable tubing – this limits microbubble formation while increasing compressibility. When a small bubble enters, pause the pump momentarily. Apply mild extra pressure so the bubble moves into the trap instead of lodging in the observation area.
What method confirms the actual flow instead of merely the instruction?
Start by measuring how much liquid flows out over a set period. Capture the output for exactly ten to twenty minutes while running at the intended setting. Once collected, record the fluid’s weight. Since density usually falls between 1.00 and 1.02 grams per milliliter, turn that mass into volume. From there, calculate the actual flow rate. Most hidden leaks or system mismatches show up during this test. When results are below expectations, try reducing the tubing length or switching to a larger syringe. Flow rates above normal suggest checking connections where small escapes may occur.
Channel layouts that evenly spread flow tend to support consistent delivery over flat cell layers.
Most reliable results come when dimensions stay within typical ranges – heights near 75 to 150 micrometers work well. Extremely broad channels tend to cause issues unless designed with components that distribute flow. Structures like small pillar arrangements or a brief expansion section before the main area help balance speed across the space. When fluid moves only along the sides, consider narrowing the channel or inserting barriers midway. Even delivery often proves more effective than simply increasing the volume pushed through.
What steps ensure chemical signals align precisely with fluid flow during timed experiments?
A sequence often follows fixed intervals – changing at a specified minute mark. Sometimes it advances in measured increments, shifting after each defined microliter passes through. Another approach uses synchronized signals, in which one electrical pulse coordinates valve movement, pressure adjustments, and image capture simultaneously. Recording exact times alongside portion numbers simplifies later review. That clarity helps when tracing results back to their origin.
For how long is it possible to maintain perfusion before cells begin lacking oxygen or suffer damage from excessive force?
At stable temperatures and with wall shear stress between 0.1 and 0.5 pascals, perfusion lasting 1 to 3 days is standard practice. When harvesting secreted proteins, adjust the collected volume to between 50 and 500 microliters to match the detection limits. Extended experiments require periodic monitoring; inspect flow rates every few hours for minor deviations up to 10%. Should automated collection be part of the setup, recalibrate its position occasionally throughout the run.
How do systems typically break right after launch?
- A gradual drop in fluid movement happens when compliance is too high. This issue improves by using stiffer tubing with reduced length. Another option is to switch to a larger syringe. Each change helps maintain more consistent pressure during delivery.
- Bubble trails appearing during stage motion? Fasten the tubing tightly. Insert a fluid trap into the setup. Wait 10-15 minutes for thermal stability before introducing cells.
- Center stagnation in wide chambers: add posts or tweak geometry.
- Warm room outlets may lose liquid through evaporation. Use a sealed container or gather samples in sealed vessels. Closing prevents loss. Containers stop air exposure. Sealing keeps volume stable. Prevent escape by covering openings.
How does the Microfluidics Innovation Center support grant applications and prototype development?
With chip layouts tuned precisely to desired flow conditions, MIC builds full systems – engineered interfaces that match selected actuators at their core. When required, sensors are embedded directly into fluid paths, ensuring data flows as smoothly as the fluid itself. Biologists operate complete setups independently; supervision is unnecessary because control loops handle variability. Custom chips emerge from cleanroom processes tailored to each project’s demands. Within Horizon Europe collaborations, including a dedicated small company such as MIC, lifts the credibility of technical design. Success rates climb notably higher than average when our team joins proposals – we’ve seen near-doubling against benchmark odds. We also help write the methods, validation, and exploitation plans so reviewers see traceability, not just intentions.
Start each run by clearly marking it: include Q, τ_w, syringe volume, tube inner and outer diameters, and chip measurements. Before beginning, wet all parts thoroughly, then warm them gradually. Record target values along with actual flow rates when data exists, pairing these notes directly with microscope images. Set aside specific cartridges for cells only, keeping them separate to prevent residue buildup from dense protein solutions.