Fraction collector for microfluidic cell culture
Author
Lisa Muiznieks, PhD
Publication Date
October 11, 2024
Keywords
Microfluidic cell culture
Fraction collector
Cell perfusion
molecular uptake
sample analysis
Need advice for your fraction collection?
Your microfluidic SME partner for Horizon Europe
We take care of microfluidic engineering, work on valorization and optimize the proposal with you
Introduction
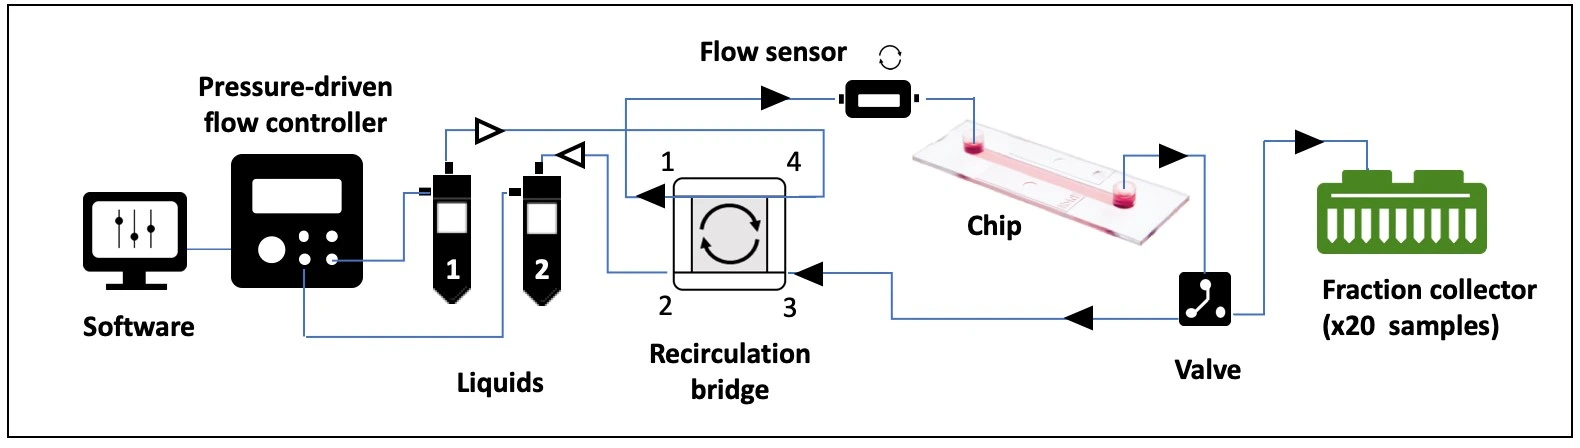
Microfluidic perfusion is a powerful addition to cells in culture. Medium and nutrients can be exchanged, waste can be removed and non-adherent cells can be circulated. Flow can also be used to add mechanical stimuli such as shear stress to the cell environment. These cues are absent in static flasks or well plates, and increase the physiological relevance of culture models. Not least, flow unlocks the ability to follow changes over time.
Collecting fractions from the culture medium using perfusion offers the great advantage of capturing time-resolved biochemical molecular snapshots for analysis of dynamics, and measuring cell responses to physiological drug residence times (pharmacokinetics/ pharmacodynamics, PK/PD). These dynamics can arise from metabolism (catabolism/ anabolism; i.e. breaking down, combining, removing or releasing molecules), feedback loops, signaling pathways, and also the transport of molecules across a semipermeable barrier, e.g. between microfluidic compartments or molecular uptake/ release across a cell membrane.
This protocol describes a microfluidic cell perfusion setup with an inline fraction collector for automated sample collection from the cell culture medium during perfusion over 20 h. Sequential fractions can be collected at user-defined intervals and volumes. Analysis of samples for a molecule of interest can be performed separately using any appropriate analysis technique (e.g. HPLC, mass spectrometry, ELISA, colorimetric assay).
Applications
Time-resolved fraction collection is highly beneficial for many applications of microfluidic cell perfusion that study changes in molecule concentration or composition, e.g., often related to metabolism, transport or uptake/ release:
- Cell metabolism (break down or appearance of molecules/ drugs with time)
- Chemical/ drug metabolism
- Molecular transport across a membrane (semipermeable support separating 2 compartments; e.g., organ-on-a-chip studies)
- Cell uptake or release of molecules/ drugs (active or passive transport across cell membranes)
- Medium (buffer) exchange (molecule dilution, concentration)
Materials
Hardware:
- Pressure-driven flow controller (e.g. OB1 MK4 with two 0-2000 mbar channels; Elveflow)
- Flow sensor (e.g. MFS3+, Elveflow)
- 3/2 valve (2-position, 3-way valve)
- Valve controller (e.g. MUX-wire, Elveflow)
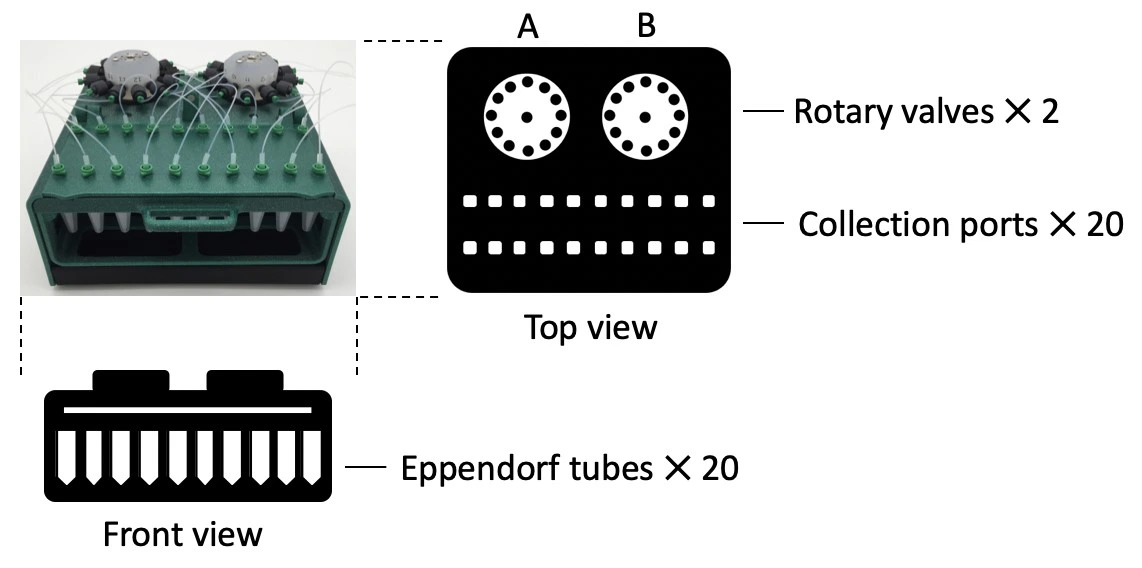
- Fraction collector unit, 20 Eppendorf collection tubes
- Recirculation bridge for unidirectional flow through the chip (4 x T-junctions, 4 x check valves)
- Tubings (PTFE, 1/16” outer diameter; OD), fittings and reservoirs
- Microfluidic resistance, 40 cm of 175 µm inner diameter (ID)
- Microfluidic chip (e.g. µ-Slide I Luer, ibidi)
Reagents:
- U-251 MG cells (0.8 x 10⁶ cells/mL)
- Medium (DMEM [+] 4.5g/L D-Glucose; with FBS 10%, penicillin, 100 U/mL / streptomycin, 100 µg/mL)
Download the MIC Horizon Europe 2026/2027 Calls Calendar:
Design of the chip
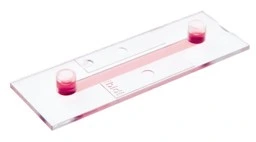
This experiment used a straight channel chip (µ-Slide I Luer 0.4; ibidi ®). The simple design and relatively large internal geometry of the chip make it straightforward to fill, seed and connect to the circuit. Its polymer coverslip base and microscope slide outer dimensions are ideally adapted for imaging, either as part of an endpoint staining protocol or for live cell imaging to monitor cell proliferation and morphology during perfusion.
µ-Slide I Luer (ibidi ®) | Features |
Interface type | Female Luer |
Chamber volume | 100 µl |
Channel l ✕ w ✕ h | 50 ✕ 5 ✕ 0.4 mm |
Surface treatment | ibiTreat tissue culture treated |
Slide base | #1.5 polymer coverslip |
Quick start guide
Instrument connection and filling
1. Connect a pressure-driven flow controller to an external pressure supply with pneumatic tubing, and to a computer.
2. Turn on the pressure controller and open the software.
3. Install and calibrate the pressure controller following the manufacturer’s instructions.
4. Connect the flow sensors to the pressure controller and software as directed by the manufacturer.
Chip preparation and seeding
1. Prepare the microfluidic chip surface, if needed.
2. Prepare cells as per standard protocol. Disperse all clumps. Count carefully and use immediately.
3. Seed the chip by filling the cell culture chamber with cell suspension. Pay attention to fill only the chamber and not the reservoirs on each side.
4. Wait 5-10 min, then gently fill the reservoirs with fresh medium (containing no cells), taking care not to disturb the cells in the chip.
5. Cover the inlet and outlet and transfer the chip to the CO2 incubator in a sterile petri dish.
6. Leave 6-18h for cells to attach, or as required for your cell type and application.
Recirculation bridge assembly
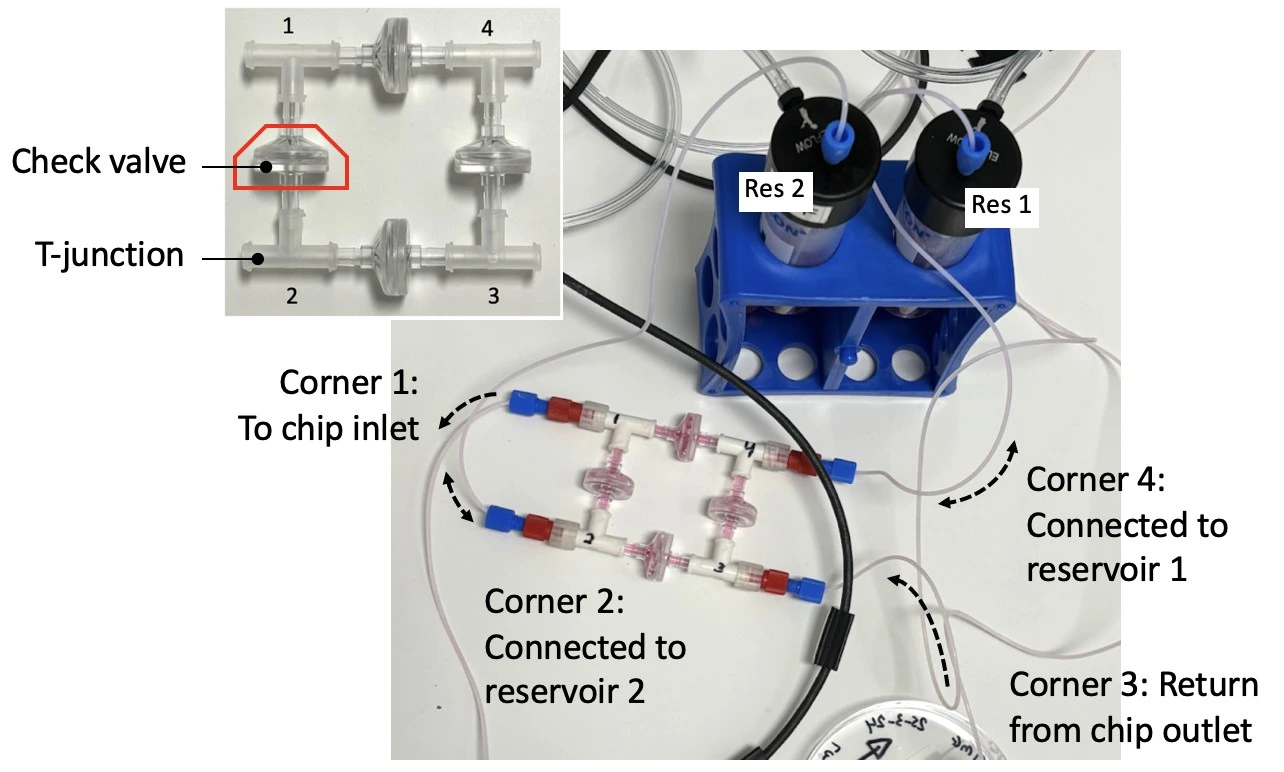
1. Autoclave the check valves and T-junctions. Similarly, cut all lengths of tubing needed to connect the bridge to the fluidic circuit, attach connectors to the ends, and autoclave.
2. Perform steps 2 and 3 in a biosafety cabinet. Connect the check valves between the T-junctions following the orientation shown in the inset of the figure below (see the full bridge assembly video tutorial or the perfusion cell culture application note for more details).
3. Tighten the structure by firmly pressing along all 4 axes. Repeat tightening, if necessary.
Fraction collector assembly
1. Connect tubing from the 3/2 valve (position “NC”; normally closed) to the center port of rotary valve A on the fraction collector.
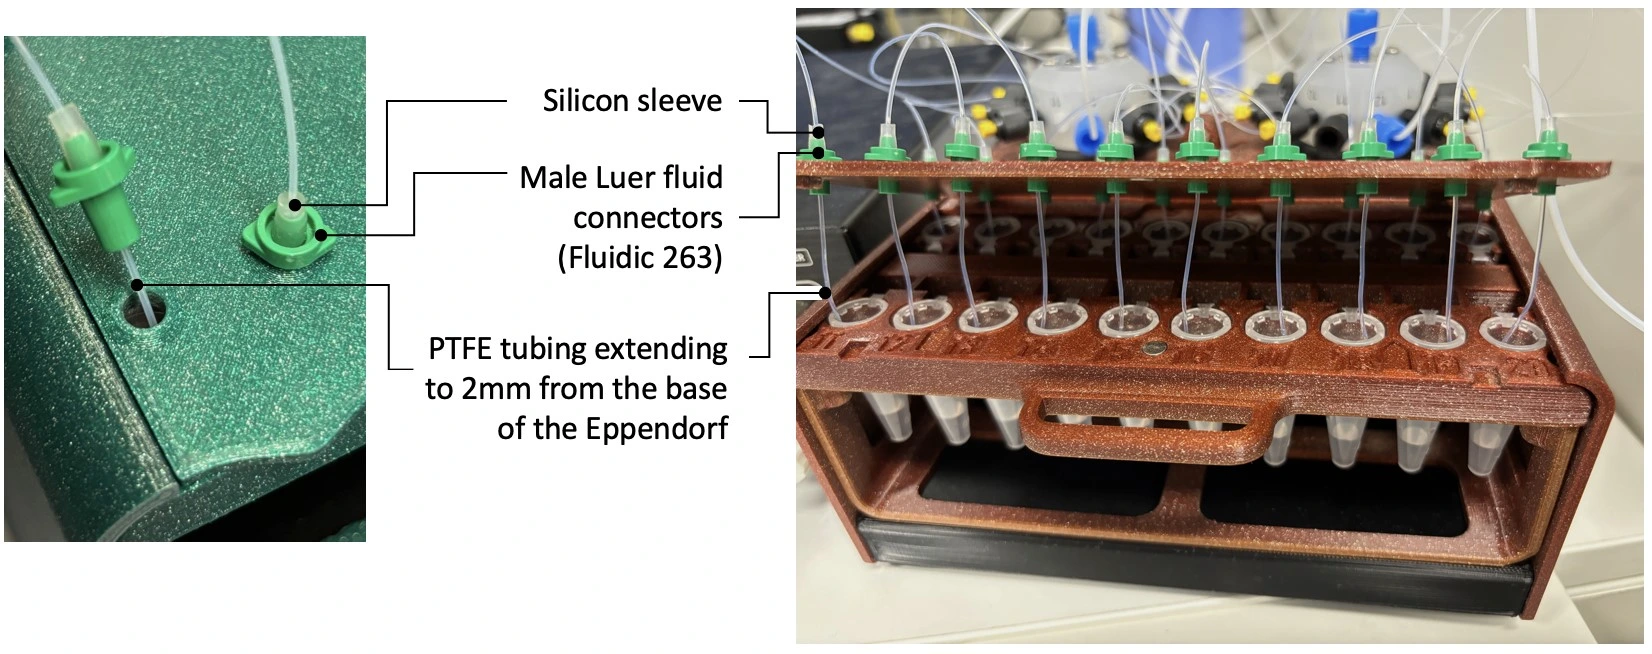
2. Connect ports 1-10 of rotary valve A to 10 collection ports. Use a short (5 mm) piece of silicon tubing sleeve and male Luer fluidic connectors (see figure below).
3. Connect port 11 of rotary valve A to the center port of rotary valve B on the fraction collector.
4. Connect ports 1-10 of rotary valve B to the remaining 10 collection ports, using connectors as above.
5. Add 20 Eppendorf tubes to the sample rack. Fold back the lids into the slot.
Fluidic circuit connection
1. Connect the reservoir caps to the pressure controller with pneumatic tubing.
2. Connect reservoir 1 to corner 4 of the recirculation bridge using 1/16” OD tubing.
3. Connect corner 1 of the recirculation bridge to the flow sensor inlet.
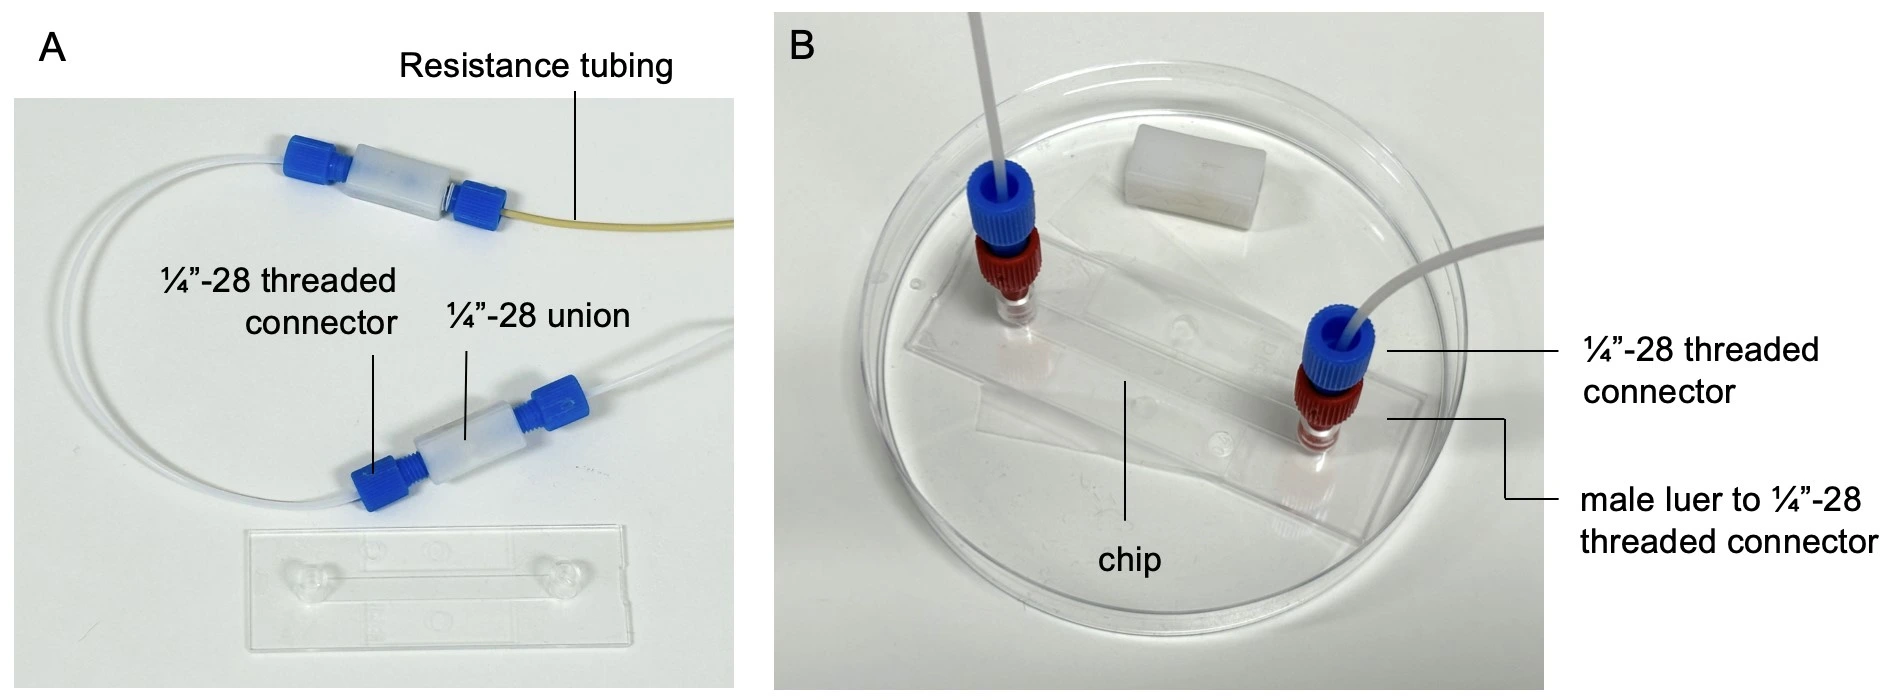
4. Connect a piece of resistance tubing to the outlet of the flow sensor. Use a union connector to then add a length of tubing. This will eventually be connected to the inlet of the microfluidic chip, but for now, add another union connector to the free end.
5. Connect tubing from the union connector (used in place of the chip until the circuit is purged of air) to the 3/2 valve that is connected to the fraction collector (use the side of the valve with only one hole). Placing the fraction collector after the chip ensures constant perfusion over cells regardless of whether a sample is being collected or not.
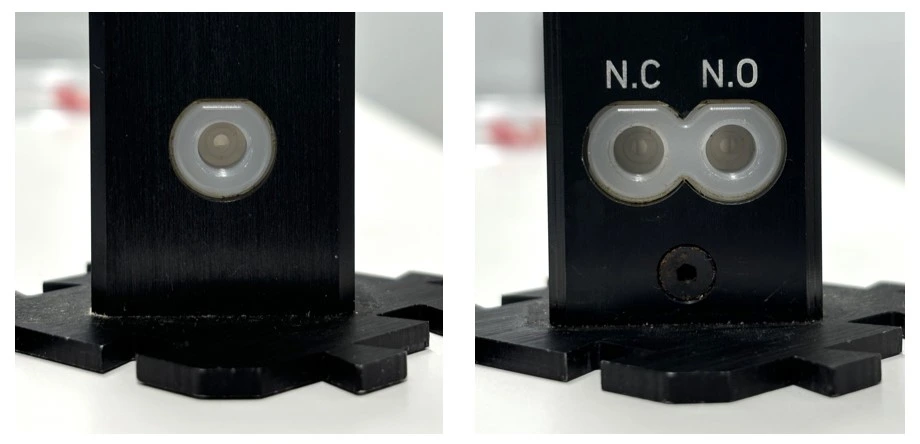
6. Connect the 3/2 valve (position “NO”; normally open) to corner 3 of the recirculation bridge.
7. Connect corner 2 of the recirculation bridge to reservoir 2.
Fill the bridge / Purge the circuit
1. Pressurize reservoir 1 to start flow. Hold the bridge with corners 1 and 2 upwards to aid removal of air (see the Bridge Filling video tutorial for more details).
2. When the liquid front has reached reservoir 2, stop pressurizing reservoir 1.
3. Ensure reservoir 2 contains enough liquid, then pressurize reservoir 2 to start flow. Hold the bridge with corners 1 and 4 upwards until the check valve between corners 1 and 2 is filled with liquid.
4. Then tilt the bridge so that corner 4 is pointing upward to remove the remaining air from the circuit.
5. Pressurize alternately reservoir 1 then reservoir 2 a few more times to ensure complete purging of air.
Chip connection to fluidic circuit
1. Once the entire circuit is filled with liquid it is time to attach the seeded chip. Ensure the inlet and outlet of the chip are completely filled with medium.
2. Disconnect the union where the chip will be added. Add a ¼”-28 threaded to male Luer connector (red) to the ¼”-28 threaded connector (blue) and start the flow from reservoir 1 at a low flow rate (e.g. 10 µl/min).
3. Wait until a small droplet of liquid is visible from the end of the tubing, then connect it to the chip inlet, touching meniscus to meniscus to avoid trapping any air.
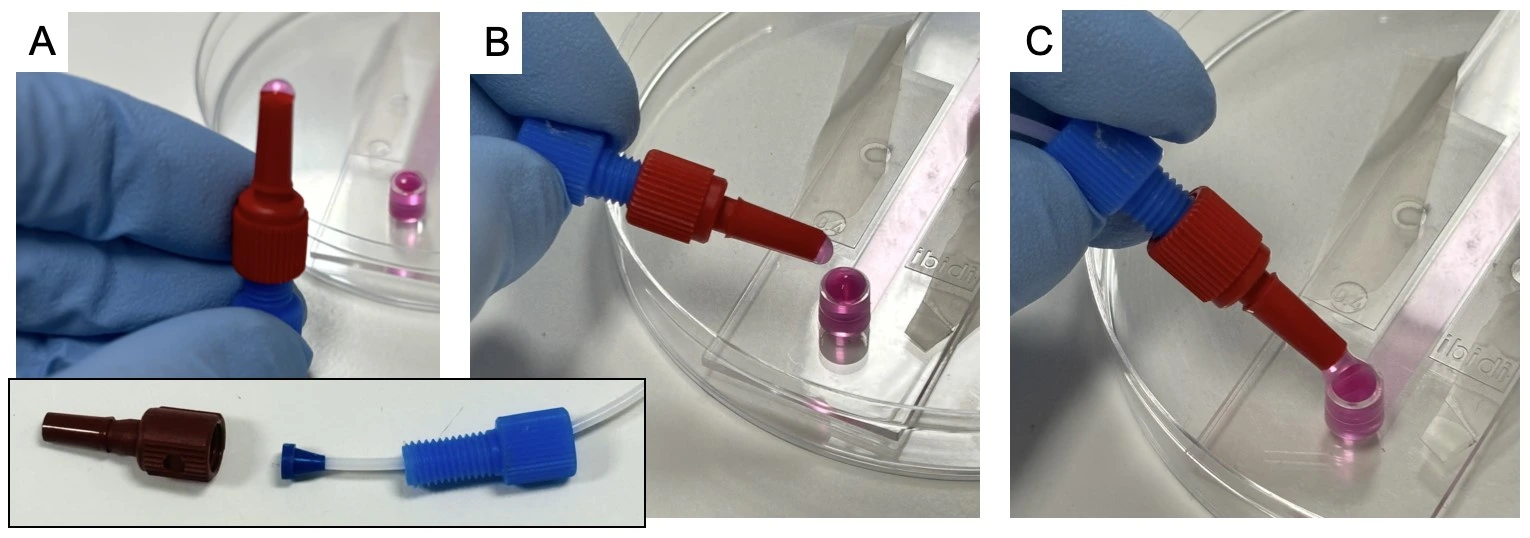
4. Add the free end of tubing to the chip outlet. Carefully wipe up any split liquid.
5. Add modules to a basket for transfer inside a CO2 incubator
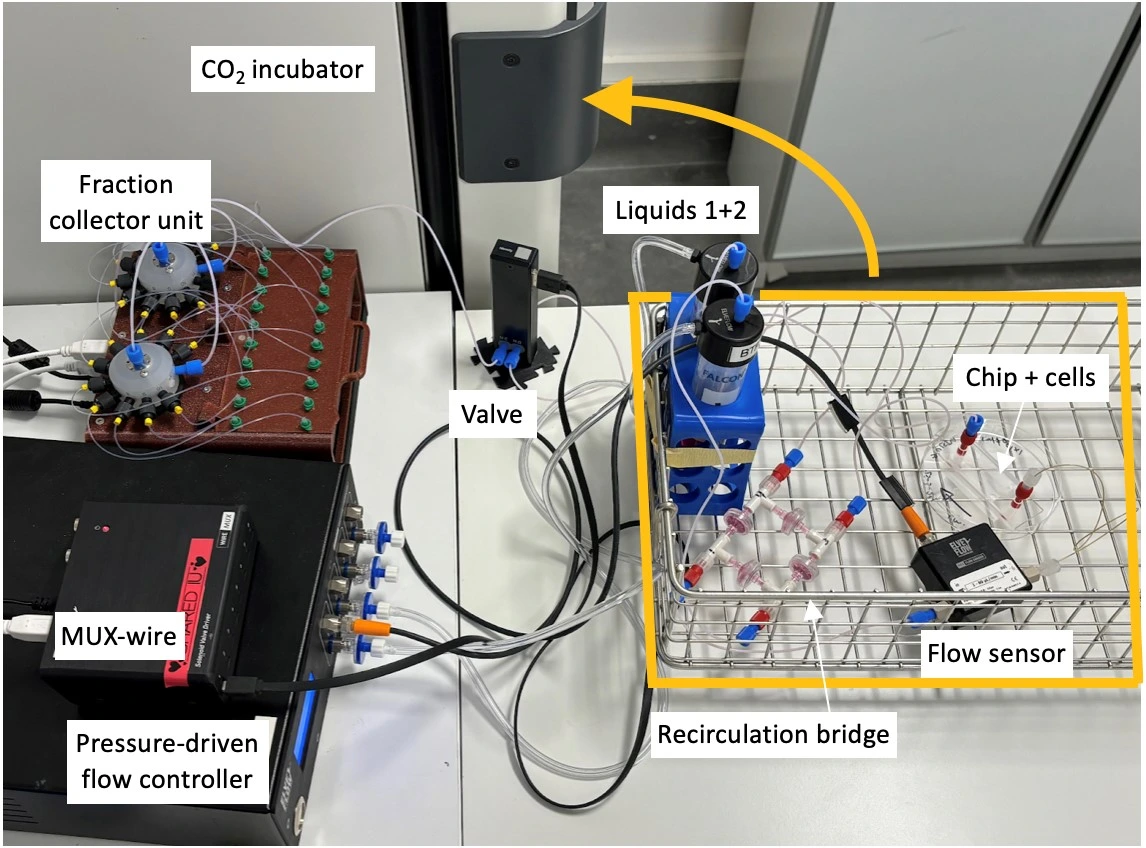
Experiment
1. Schedule liquid recirculation between reservoirs 1 and 2 using the software of the pressure-driven flow controller (e.g. Elveflow Software Interface; ESI).
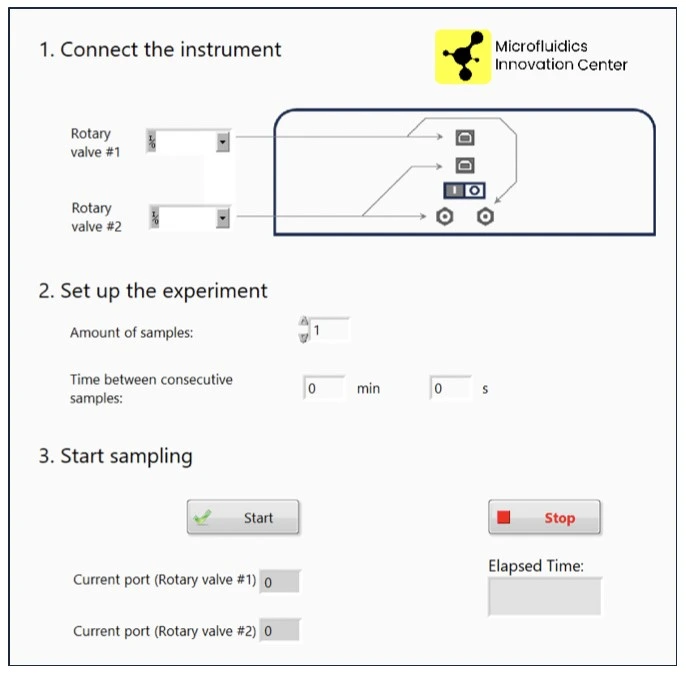
2. Schedule sample collection with the dedicated fraction collector software (MIC).
3. Flow at desired flow rate for desired time (e.g., 10 µl/min for 20 h).
4. Analyze (e.g., image cells in the chip or downstream analysis of collected fractions etc).
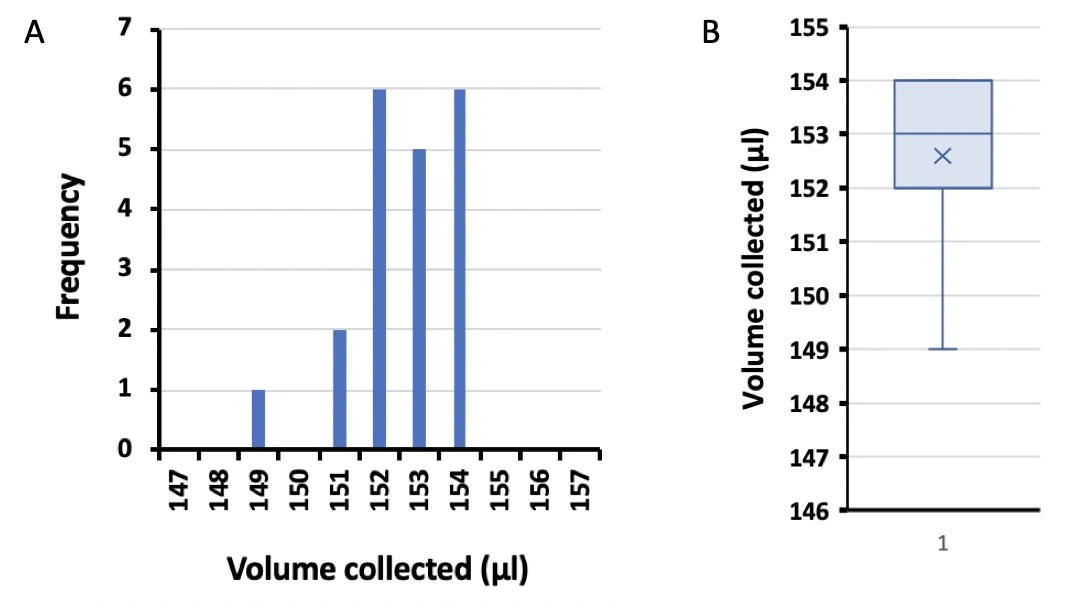
Results
Cells were cultured with perfusion for 20 h. Samples (150 µl) were collected by the fraction collector module once per hour. Volumes were determined by weighing the tubes before and after collecting fractions, shown below (Figure 1).
More tips included in the Application Note PDF!
Acknowledgements
This application note was written under funding from the European Union programs:
Horizon 2020 research and innovation program, grant agreement no. 101036702 (LIFESAVER, project page),
and H2020-LC-GD-2020-3, grant agreement no. 101037090 (ALTERNATIVE, project page).
Written by MIC in collaboration with LIFESAVER project partner, Institute for Research and Innovation in Health (I3S).
This application note was written by Lisa Muiznieks, PhD.
Published in October 2024.
Contact: Partnership[at]microfluidic.fr
Check the other Application Notes
FAQ - Fraction Collector for Microfluidic Cell Culture
Why does this arrangement address a real issue?
A microfluidic chip enables cell growth while precisely collecting outgoing fluid at regular intervals. Over time, this captures a sequence of released substances – such as metabolites, cytokines, and extracellular vesicles – while keeping cells undisturbed and the process continuous. The experiment runs without interruption, preserving natural secretion patterns throughout.
What does the physical setup look like when applied?
Media moves through the system when driven by a syringe pump or pressure source, introducing solutions along with any required triggers. Within the core section, cells grow inside a microfluidic chip designed to capture unwanted air pockets. Flow then continues into a narrow tubing segment with minimal residual space, guiding output toward a timed collection unit that switches vials either after set intervals or upon reaching defined volumes. As supplementary components, one may include a built-in flow monitor to verify delivery rates and a basic light-sensitive diode that records the exact start of each applied signal.
Which fractionation dimensions and collection schedules are suitable for cell-secretome studies?
Most tests run fine with 50 to 500 microliters in each fraction. Flowing at five microliters per minute means one tube fills every 10 to 100 minutes. Twenty microliters per minute cuts that down to between two and twenty-five minutes. When tracking rapid reactions not tied to gene activity – like shifts in ions – smaller portions combined with faster flow give clearer results. Slower processes, like protein release, benefit from bigger fractions collected more gently. Less disturbance means cleaner data over time.
What factors guide flow rate selection to prevent cell stress?
Flow turns into wall shear stress depending on the shape of your chamber. Usually, mammalian cells that stick can handle 0.1 to 1.0 Pa during extended flows. A taller or wider channel might require more volume to maintain renewal – change size before changing speed.
What steps prevent mix-up between neighboring samples?
Short, stiff tubing helps reduce delays at the outlet. Instead of long bends, pick a collector that limits how far liquid must move between stages. After every indexing motion, include a quick pre-fill phase to keep leftover fluid in the nozzle separate from what follows. Well-designed flow paths often reduce residual transfer to 1–2 percent or less of each sample portion. A stepwise dye check using fluorescein confirms whether levels stay within range.
How does dead volume affect results?
Timing and precision matter.
Start by measuring the amount of fluid between the chip exit and the tube entry. This unused space adds a consistent gap between what happens near the cells and when that sample reaches the collection tube n. Calculate its size by multiplying the length by the inner diameter, and record it only once. During data review, adjust timing stamps based on this value. Suppose each fraction takes ten minutes to gather, flow runs at 12 microliters per minute, and the inactive volume totals 120 microliters – a full 10-minute offset appears. Correcting for this lag turns out straightforward.
What is the method to align stimuli with data gathering?
- Time-based: index tubes every T minutes and switch stimulus at a known clock time.
- Volume-driven setups: track each microliter incrementally; shift the input once the counter advances – this handles sudden shifts more smoothly. The approach responds better when transitions need precision.
- TTL-based: A signal shared by the stimulation valve and the collector follows a TTL pattern; mark where the transition occurs in your recorded data. Timing alignment matters because a single common pulse activates both components; note the shift point clearly. The moment the voltage shifts defines system coordination; capture that instant precisely in logging.
Is it possible to maintain sterility throughout extended operations lasting several days?
Yes – use sterile, pre-assembled cartridges or autoclave-compatible tubing, add a 0.22 µm inline filter upstream, and park the fraction collector inside (or immediately outside) the incubator with a dust cover. Collect into sterile, capped tubes and avoid re-opening during the run. A dedicated cartridge for cell work avoids memories from protein-rich media.
What method confirms the accuracy of fractional timing along with concentration levels?
Begin by using two tracers at once: one stable substance, such as fluorescein, helps track timing steps, while the other binds to proteins to simulate adsorption. Capture signals across each collected portion using a microplate detector. The smaller dye shows up as a quick shift within just one or two segments, whereas the binding tracer spreads more gradually. Present results, including the span from 10% to 90% signal increase, leftover trace amounts between runs, and variability measured per segment.
On day one, what problems might appear?
- Bubbles forming in heated fluid channels can be prevented by installing a waterrepelling membrane filter upstream of the device. This barrier captures air pockets early, preventing interference downstream. The setup stays simple yet effective when positioned correctly along the flow path.
- A fraction sits wrong following extended time in the incubator. Check alignment before starting. Misplacement tends to happen after several hours. Realign the system every four to six hours. Starting correctly reduces later issues.
- A drop in flow rate might come from overly long flexible tubing – try shortening it or switching to a wider syringe. When pressure is applied, ensure the collection container remains free of builtup pressure.
- Patches of flow at the chamber edges need attention; inserting supports helps balance forces across broader areas. Spacing adjustments achieve similar results by limiting the distances fluid must cross.
What happens when you try swapping tubes by hand instead?
When dealing with just a few samples, manual switching works well enough. Yet it brings delays measured in seconds. These pauses add up, creating gaps where things drift. Temperature may shift during these intervals. Using a motor-driven system avoids such inconsistencies. Dwell periods stay consistent across runs. Switching between streams becomes sharper. There is less contamination risk at transfer points. Overnight collection proceeds without supervision. This reliability matters most when linking results to imaging data. Matching timing precisely also supports accurate gene expression analysis.
Are there specific figures readers expect within the procedure section?
Start with basic setup details, such as channel size and intended shear force. Flow settings matter – include what was set versus what sensors recorded. Note system delays, including how much fluid remains unused and when delivery lags occur. Mention the portion sizes alongside the pause durations, and track residual transfer between samples as a percentage. Record how fast the flow reaches the target, using minutes or decimal parts. Temperature must appear too. When triggers were applied, define their strength patterns – sudden jumps or gradual slopes – and tie each shift precisely to sample order.
Is scaling possible for the system when handling multiple test conditions?
Yes. Split the outlet into parallel collectors or use a multi-row rack to run repeated stimuli cycles in a single day. With 5 µL/min and 100 µL fractions, you can capture a 12-hour, 7-condition experiment in 84 tubes – manageable for ELISAs or LC-MS.
Suppose we include it within a proposal or early model – where exactly would the Microfluidics Innovation Center sit? How might its role shift depending on whether funding comes through grants or hands-on development work?
Starting from scratch, MIC builds complete systems – the shape of the chip, tight fluid paths, separation methods, along with how data moves – freeing biologists to run experiments without wrestling hardware. Custom microchips come out of our workshop, sensors fit directly into flow lines, and working models arrive ready to test. Within Horizon Europe teams, adding a niche player such as ours tends to raise project maturity; in practice, recent submissions show about twice the win rate as average odds. Mapping collected samples to real biological insights? That part is shaped early, hand in hand, through shared planning of verification steps.
What insights come up once you’ve done something more than twice?
Start by marking each tube with the exact clock time and its fraction number. Position the nozzle directly in the middle of each cap so liquid does not run up the sides. Before starting, moisten the nozzle slightly – this stops the initial drop from skewing results. When gathering very small portions, insert a short, flush stroke at each step to gently clean the tip, avoiding splashes. Finish each cycle with clarity in mind.