Visualizing microfluidics: Matching imaging techniques to research needs
Writer
Celeste Chidiac, PhD
Keywords
Microfluidic Devices, Intelligent Microfluidics, Artificial Intelligence, Machine Learning
Author
Celeste Chidiac, PhD
Publication Date
Keywords
Imaging techniques
Optical imaging
Tomography techniques
Electron microscopy methods
Need advice for your microfluidic imaging techniques?
Your microfluidic SME partner for Horizon Europe
We take care of microfluidic engineering, work on valorization and optimize the proposal with you
Introduction to imaging techniques
Microfluidics is both the science and technology that precisely control fluids at the microscale and manufacture microminiaturized devices. The recent advances in microfluidics have enabled great progress in diagnostics, material synthesis, and cellular studies. Thus, there is an increasing need for accurate, high-resolution imaging and quantitative analysis. Visualization of microfluidic processes is crucial for comprehending fluid dynamics, particle transport, and biochemical interactions in these systems.
This review gives an overview of the main microfluidic imaging techniques applied in research. It starts with optical methods, including bright-field microscopy, chemiluminescence detection, spectroscopy, and fluorescence microscopy, then it addresses tomography methods such as X-ray and neutron imaging, followed by electron microscopy techniques. A summary of each imaging principle, limitations, and applicability to microfluidic systems is given in Table 1.
Table 1: Features, limitations, and applications of each imaging technique [2].
Imaging techniques | Image dimensions | Image resolution | Features | Limitations | Selected applications |
Bright-field microscopy | 2D | 200-500 nm | Simple, fast, label-free | Low contrast, no molecular info | Morphology, droplet tracking, microchannel visualization |
Chemiluminescence imaging | 2D | Low (pixel-limited) | No excitation source, low background noise | No spatial detail, limited real-time capability | On-chip enzymatic assays, immunoassays |
Raman microscopy | 3D | 0.5-1 µm | Label-free, chemical specificity | Weak signal, slow, laser heating risk | Molecular identification, Raman mapping |
Surface plasmon resonance (SPR) | 2D | 1-10 µm | Label-free, real-time biomolecular interaction | Low spatial resolution | Biosensing, affinity measurement, diagnostics |
Confocal microscopy | 3D | 200 nm lateral / 500 nm axial | Optical sectioning, high resolution | Slow, phototoxic, expensive | Subcellular imaging, tissue-on-chip, biomarker mapping |
Light-sheet microscopy | 3D | 300-500 nm | Fast, low phototoxicity, volumetric imaging | Complex alignment, orientation-sensitive | Organ-on-a-chip, live cell imaging |
Imaging flow cytometry | 2D | 300-700 nm | High-throughput imaging and quantification | Data-heavy, high-speed optics needed | Cell classification, biomarker analysis in flow |
X-ray tomography | 3D | 1-50 µm (synchrotron), 50-500 µm (industrial & medical) | Internal imaging, high-density contrast | Operator dependency, imaging artefacts | Pore structure, multiphase flow |
Neutron tomography | 3D | 16-100 µm | High penetration depth, large samples | Longer acquisition, lower resolution, limited access | Fluid distribution in porous media, phase separation |
Scanning electron microscopy (SEM) | 3D | 1-10 nm | High-resolution surface detail | Not appropriate for heterogeneous samples | Microfluidic surface, material analysis |
Transmission electron microscopy (TEM) | 2D | 0.1-1 nm | Ultrastructure, internal morphology | Complex prep, small field of view | Nanoparticles, membrane structure, liposomes |
Optical imaging techniques
Optical techniques are the most commonly used imaging approaches in microfluidics. They are non-invasive and compatible with live, real-time monitoring. Moreover, they enable the direct visualization of flow profiles, cellular dynamics, chemical gradients, and molecular interactions. Optical techniques can have different resolutions and sensitivities, and include bright-field microscopy, fluorescence, and spectroscopy.
Bright-field microscopy
Bright-field microscopy is a standard technique in imaging that is based on light transmission, providing direct sample illumination. It is often used for initial system characterization and real-time tracking of droplets, as well as visualization of microchannels.
Kim et al. used this imaging technique to track the motility of Chlamydomonas reinhardtii within an acoustofluidic device. The researchers integrated algae as dynamic tracers to map the acoustic pressure field. The results were as accurate as with conventional methods [3]. Advanced imaging techniques are being developed, including bright-field imaging and complementary techniques.
Chemiluminescence
Chemiluminescence imaging techniques are based on light emission generated during chemical reactions; thus, they do not require excitation sources or optical filters. Its simplicity and low instrumentation requirements make it suitable for lab-on-chip platforms.
Neumair et al. implemented an automated chemiluminescence-based microarray to screen binding interactions of proteins, antibiotics, and lectins with bacteria. Detection relied on luminol-Horseradish Peroxidase (HRP) reaction to quantify bound bacteria (Figure 2). The authors were able to identify novel binding behaviors, such as polymyxin B interactions with Enterococcus faecalis, and effective elution agents for bacterial release [4].
Spectroscopy
Spectroscopy imaging techniques are based on light interactions such as absorption, emission, and Raman scattering to characterize molecular and chemical properties in situ. They are suitable for monitoring concentration gradients, reaction kinetics, and biochemical pathways within microfluidic channels.
Raman microscopy
Raman microscopy works by detecting inelastic scattering of light. This reveals molecular vibrations and allows high-specificity chemical imaging without labels.
Poonoosamy et al. combined this imaging technique with a flow-through microreactor. They studied mineral dissolution and crystal precipitation under flowing conditions. This setup allowed direct 3D observation of surface changes in porous media [5].
Ozeki et al. advanced the method by developing a multicolor stimulated Raman scattering (SRS) system with tunable fiber lasers. This system enabled fast, multiplexed imaging of live samples without labeling (Figure 3) [6].
Surface plasmon resonance (SPR)
Surface plasmon resonance (SPR) occurs when a photon of incident light hits a metal surface and measures the changes in the reflected light. By removing the need for labels, this technique allows real-time microfluidic imaging and the analysis of binding kinetics.
Xiao et al. integrated a 3D-printed microfluidic channel onto a SPR sensing surface (Figure 4), achieving reliable sensing under high flow, while a smartphone camera recorded signals. The platform enabled real-time monitoring of protein interactions at low cost and footprint, making it suitable for portable biosensing applications [7].
Fluorescence microscopy
Fluorescence microscopy is the most used optical imaging technique in microfluidics due to its sensitivity and specificity. It enables quantitative detection of low-concentration samples and the dynamic visualization of cellular or molecular events.
Aldridge et al. applied time-lapse fluorescence microscopy within microfluidic chambers to track growth, division, and morphological changes in single Mycobacterium cells under controlled antibiotic exposure (Figure 5). In addition, phase-contrast imaging provided structural visualization [8]. This setup can be used to investigate the heterogeneity of drug responses within bacterial populations.
Confocal microscopy
A confocal microscope uses focused illumination and detection at the same spot, capturing one point at a time during a scan. This imaging technique enables optical sectioning, allowing for high-resolution 3D reconstruction of the sample.
Witt et al. combined confocal laser scanning microscopy (Figure 6) with bright-field imaging to examine the nucleation of calcium carbonate inside giant unilamellar vesicles formed by droplet microfluidics. Fluorescent labeling defined vesicle boundaries, while confocal imaging captured crystal growth and lipid-crystal interactions [9].
Light-sheet fluorescence microscopy (LSFM)
The light sheet fluorescence microscopy (LSFM) illuminates samples with a thin light sheet perpendicular to the sample. It reduces photobleaching and enables rapid volumetric imaging, which is suitable for live-cell imaging.
Memeo et al. used LSFM to image Drosophila embryos in a microfluidic chamber under dynamic flow. It used dual-sided waveguide illumination to minimize light scattering and motion blur, and improve resolution [10].
An Airy-beam LSFM system integrated with quantitative phase imaging (QPI) (Figure 7) allowed a wider field of view while maintaining low phototoxicity. It acquired structural (fluorescent) and biophysical (phase-based) data from flowing cells, which can be used to study metabolic localization influenced by cellular noise [11].
Imaging flow cytometry
Flow cytometry imaging techniques couple flow cytometry with microscopy for high-throughput single-cell analysis.
Yuan et al. developed a microfluidic imaging flow cytometry platform combining high-speed fluorescence and bright-field microscopy (Figure 8). The authors used a method that generates elasto-inertial 3D blur-free images of objects moving at high linear velocities. The system enabled subcellular localization down to 500 nm, with throughputs exceeding 60,000 and 400,000 cells/sec for fluorescence and bright-field detection, respectively. The system supported detailed analysis of structures such as P-bodies and stress granules while remaining compact and cost-efficient [12].
Tomography imaging techniques
Tomography provides 3D microfluidic imaging by reconstructing a large number of projections while the sample is rotated. It allows detailed observation of internal geometries and multiphase flows that are inaccessible to single-angle imaging.
X-ray
Synchrotron-based X-ray multi-projection imaging (XMPI) captures multiple X-ray images from different angles at the same time, providing high-resolution, real-time 3D visualization of complex flow structures.
An example that highlights these advantages is the study by Rosén et al., who split the synchrotron beam into angular projections and captured them simultaneously, achieving rotation-free 4D imaging (Figure 9). The result was rotation-free 3D imaging with millisecond and micrometer precision, all without disturbing flow dynamics [13].
Neutron tomography
Neutron tomography imaging techniques use neutron beams to generate images based on the material’s neutron absorption. By capturing multiple 2D projections at different angles, it reconstructs a detailed 3D view of the object’s internal structure.
Zhang et al. used high-speed neutron radiography to study the cavitation in fast liquid flowing within microchannels (Figure 10). Given neutrons’ properties to pass through opaque materials and being sensitive to hydrogen, the technique was able to capture vapor bubble formation and movement. The method worked in flow conditions where normal optical and X-ray imaging could not [14].
Electron microscopy imaging techniques
Electron microscopy provides imaging at the nanometer scale, allowing detailed examination of microfluidic channel structures, surface morphologies, and nanoparticle behavior. These techniques require high-vacuum conditions and specific sample preparation to resist exposure to the electron beam.
Scanning electron microscopy (SEM)
In scanning electron microscopy (SEM), an electron beam is focused on a specimen across a surface, emitting electron signals that reveal morphology and material composition. This technique is suitable for the structural characterization of microfluidic surfaces and materials.
Ling et al. studied the dissolution of natural rocks in microfluidic devices. Time-lapse optical microscopy tracked grain erosion during reactive flows, followed by SEM and energy-dispersive X-ray spectroscopy (EDX) to map surface structure and chemistry (Figure 11). EDX relies on the capacity of X-rays to eject ‘core’ electrons from the sample’s atom. Based on the frequency of light released, the atomic number of the atom can be determined.
The whole setup helped to understand how mineral dissolution is controlled by chemical composition and physicochemical heterogeneity at a specific flow rate [15].
Transmission electron microscopy (TEM)
Transmission electron microscopy (TEM) transmits a high-energy electron beam through ultra-thin samples to visualize internal features and nanostructures at near-atomic resolution.
Yuka et al. used TEM with small-angle X-ray scattering (SAXS) to study liposome formation under varying flow rates in microfluidic systems (Figure 12). SAXS is based on measuring the intensity of the scattered X-ray beam downstream as a function of the angle.
The setup was able to show how lipid concentration and flow rates influenced liposome morphology. The link between nanoscale structure and functional performance can provide a better understanding of liposome behavior in drug delivery [16].
Conclusion- Towards merging imaging techniques with automation
Integrating imaging with microfluidics has improved the visualization of processes at the microscale. Optical methods provide accessible, real-time monitoring of live samples, while Raman microscopy, SPR, and confocal imaging enhance molecular sensitivity and spatial resolution. Light-sheet microscopy supports fast 3D imaging with minimal damage, and imaging flow cytometry enables high-throughput single-cell analysis, although it is limited to 2D. Tomography techniques reveal internal geometries of opaque materials that are inaccessible to single-angle imaging, while electron techniques can reach the nanoscale structure, but require sample preparation. There is no conventional method for microfluidic imaging; however, combining several imaging approaches with automated analysis is promising for studying complex systems in microfluidic environments.
References
- Li, Y. J., et al., A Microfluidic Micropipette Aspiration Device to Study Single-Cell Mechanics Inspired by the Principle of Wheatstone Bridge. Micromachines, 2019. 10(2): p. 131.
- Jahanbakhsh, A., et al., Review of Microfluidic Devices and Imaging Techniques for Fluid Flow Study in Porous Geomaterials. Sensors (Basel), 2020. 20(14).
- Kim, M., R. Barnkob, and J.M. Meacham, Rapid measurement of the local pressure amplitude in microchannel acoustophoresis using motile cells. The Journal of the Acoustical Society of America, 2021. 150(2): p. 1565-1576.
- Neumair, J., M. Elsner, and M. Seidel, Flow-Based Chemiluminescence Microarrays as Screening Platform for Affinity Binders to Capture and Elute Bacteria. Sensors (Basel), 2022. 22(22).
- Poonoosamy, J., et al., Microfluidic flow-through reactor and 3D Raman imaging for in situ assessment of mineral reactivity in porous and fractured porous media. Lab on a Chip, 2020. 20(14): p. 2562-2571.
- Ozeki, Y., et al., Multicolor Stimulated Raman Scattering Microscopy With Fast Wavelength-Tunable Yb Fiber Laser. IEEE Journal of Selected Topics in Quantum Electronics, 2019. 25(1): p. 1-11.
- Xiao, C., et al., Print-and-stick unibody microfluidics coupled surface plasmon resonance (SPR) chip for smartphone imaging SPR (Smart-iSRP). Analytica Chimica Acta, 2022. 1201: p. 339606.
- Mistretta, M., N. Gangneux, and G. Manina, Microfluidic dose–response platform to track the dynamics of drug response in single mycobacterial cells. Scientific Reports, 2022. 12(1): p. 19578.
- Witt, H., et al., Precipitation of Calcium Carbonate Inside Giant Unilamellar Vesicles Composed of Fluid-Phase Lipids. Langmuir, 2020. 36(44): p. 13244-13250.
- Memeo, R., et al., Automatic imaging of Drosophila embryos with light sheet fluorescence microscopy on chip. J Biophotonics, 2021. 14(3): p. e202000396.
- Subedi, N.R., et al., Integrative quantitative-phase and airy light-sheet imaging. Sci Rep, 2020. 10(1): p. 20150.
- Holzner, G., et al., High-throughput multiparametric imaging flow cytometry: toward diffraction-limited sub-cellular detection and monitoring of sub-cellular processes. Cell Reports, 2021. 34(10): p. 108824.
- Rosén, T., et al., Synchrotron X-Ray Multi-Projection Imaging for Multiphase Flow. 2024.
- Karathanassis, I.K., et al., Quantification of cavitating flows with neutron imaging. Scientific Reports, 2024. 14(1): p. 26911.
- Ling, B., et al., Probing multiscale dissolution dynamics in natural rocks through microfluidics and compositional analysis. Proceedings of the National Academy of Sciences, 2022. 119(32): p. e2122520119.
- Shah, F.A., K. Ruscsák, and A. Palmquist, 50 years of scanning electron microscopy of bone—a comprehensive overview of the important discoveries made and insights gained into bone material properties in health, disease, and taphonomy. Bone Research, 2019. 7(1): p. 15.
- Matsuura-Sawada, Y., et al., Controlling lamellarity and physicochemical properties of liposomes prepared using a microfluidic device. Biomaterials Science, 2023. 11(7): p. 2419-2426.
Funding and Support
This review was written under the European Union’s Horizon research and innovation program under the Marie Skłodowska-Curie grant agreement no. 101119729 (NEXTSCREEN),
and the French Agence Nationale de la Recherche (ANR) with project ID: ANR-21-CE15-0045 (TREATABLE).
This review was written by Celeste Chidiac, PhD, and Yuwei Liu, PhD candidate
Published in August 2025.
Contact: Partnership[at]microfluidic.fr
Check the other Reviews
FAQ - Visualizing microfluidics: Matching imaging techniques to research needs
What might a practical starting point look like when only fast, unmarked imaging of channels, droplets, or shapes is needed?
Begin with bright-field microscopy. Simple setup, quick imaging, no labels needed – resolution usually falls between 200 and 500 nanometers when viewing flat samples. Shape and movement are clearly visible, yet details about molecules remain hidden. In droplet-based systems, this method tracks changes in volume, drop formation frequency, and merging events. On lab-on-a-chip devices, it proves reliable during positioning tasks and initial checks.
What makes fluorescence techniques worth using?
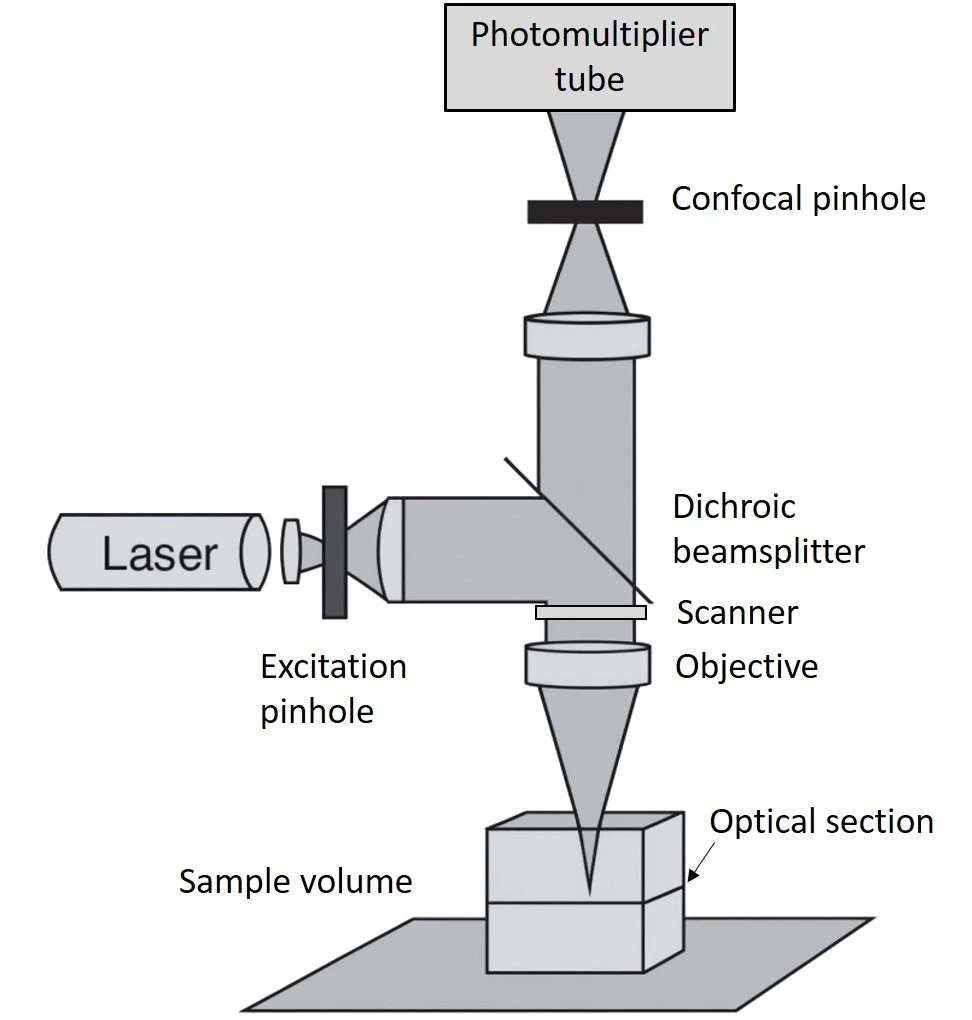
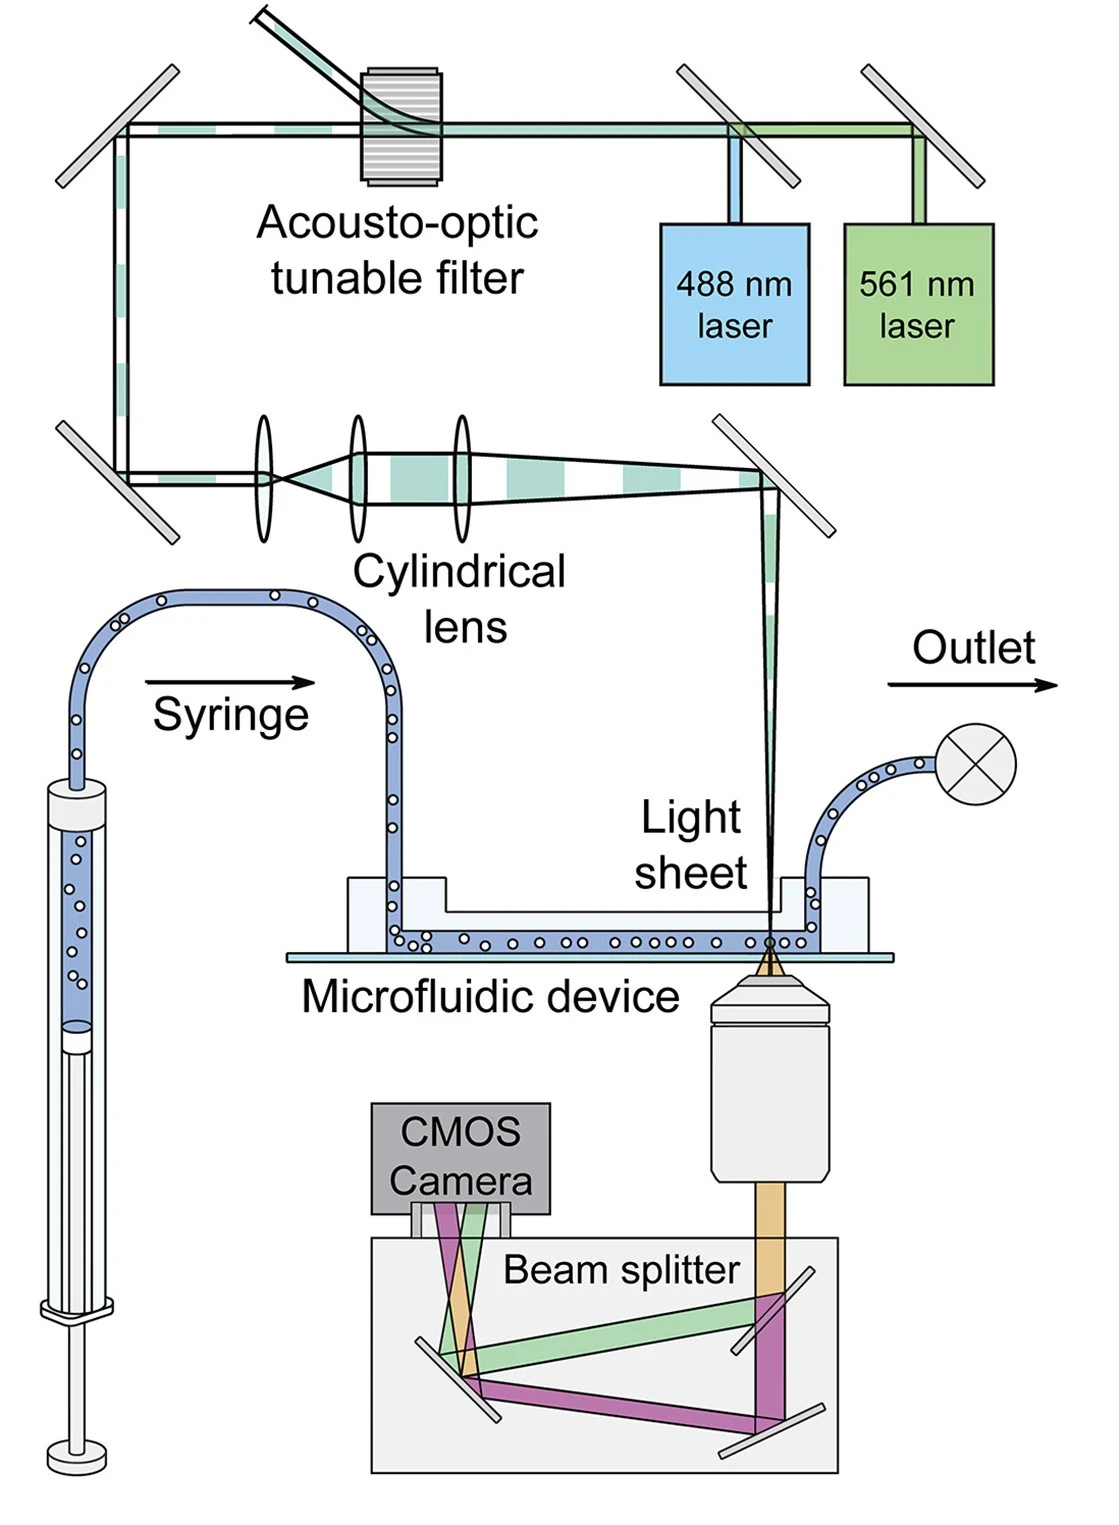
When detecting rare cells or fine biological changes, precision becomes key. Though basic widefield methods are simple, their limitations become apparent in crowded signals. Confocal setups improve clarity by slicing through layers optically, resolving details down to about 200 nanometers sideways and 500 along the depth. A different route emerges with light-sheet systems: they scan entire volumes rapidly while sparing delicate specimens from damage. Because of this gentle speed, such microscopes suit fragile living tissues or lab-grown organs where stability matters most.
Which route works best for obtaining unlabeled chemical data? Information must come free of tags or markers.
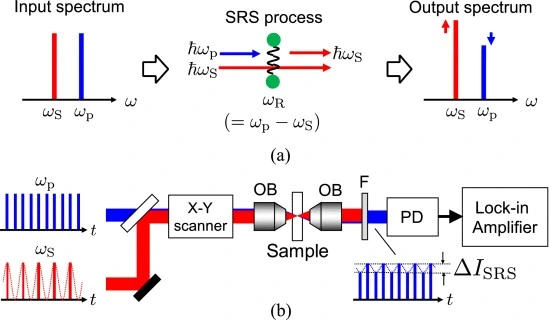
A closer look at analysis tools shows promise for certain methods. One such method is Raman microscopy, offering chemical specificity without labels. This technique resolves about 0.5 to 1 micrometer, supporting three-dimensional imaging. Signals tend to be faint, however, which affects data-collection speed. When working with materials that absorb light, the laser’s heat may become noticeable.
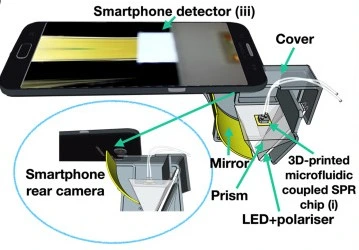
Imaging via surface plasmon resonance captures molecular binding events without dyes, tracking changes as they happen. Though limited to a micrometer-scale view – ranging from one to ten – it delivers strong time-resolved information right on the sensor chip. What stands out is its ability to measure molecular binding strength, making it effective for monitoring interaction dynamics across surfaces.
How does overall throughput look when measuring one cell at a time across large samples?
A fresh blend of flow cytometry and microscope methods forms imaging flow cytometry. Flat pictures emerge – no depth included – with clarity between roughly 300 and 700 nanometers. What stands out is speed paired with visual detail: sorting cells, spotting uncommon cases, measuring multiple markers – all while fluid moves. Shifts happen behind the scenes once images are captured; analysis slows things down more than capture now. Handling streams of image data becomes essential, quietly changing where effort lands.
When dealing with non-transparent substances, visibility into intricate three-dimensional forms becomes a challenge. Could light-based methods truly suffice under such conditions?
It does not happen every time. When needed, tomographic techniques are used.
Imaging inside objects becomes possible through X-ray tomography, where differences in material density create contrast. When using synchrotron sources, the detail levels range from 1 to 50 micrometers. Lab-based or industrial scanners usually show features ranging from about 50 to 500 micrometers. Precision depends heavily on the setup’s design and source intensity.
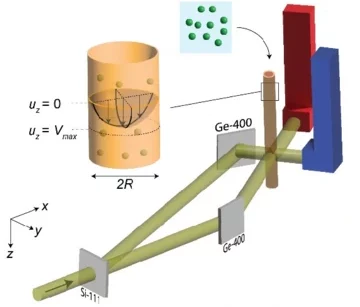
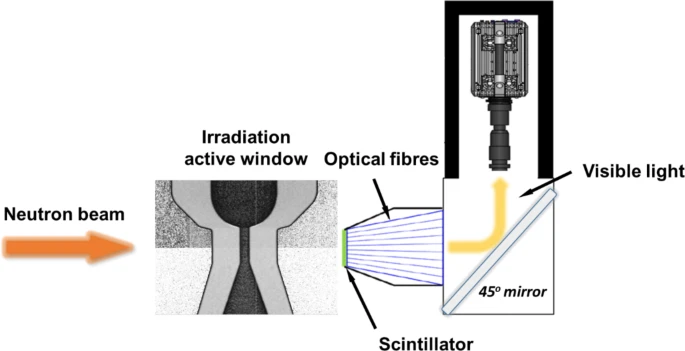
With neutron tomography, spatial detail ranges between 16 and 100 micrometers – less sharp than some methods. Yet it moves deeply through materials, detecting hydrogen-rich substances with high clarity. This makes it useful when examining how liquids spread inside metal structures. Cavities within solid forms become visible as well. Even complex mixtures of phases show up clearly, cases where X-ray imaging often fails.
When it comes to studying porous materials, hidden pathways, and shifting pore structures, few methods match their effectiveness – despite challenges like limited accessibility, delays in data collection, or unwanted imaging distortions that often come along. Yet these limitations don’t outweigh the insight gained when observing internal changes over time.
When do I truly need electron microscopy?
Where scientific outcomes depend on features at the nanometer level or interactions occurring at material surfaces.
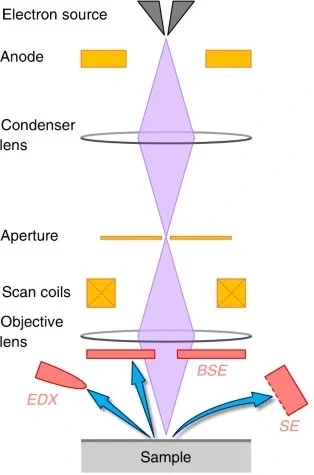
A look at surface shape often begins here – scanning electron microscopy reveals features as small as one to ten nanometers. Surface textures, such as those in narrow passages or along treated layers, are clearly visible under this method. Where materials break or wear, it helps pinpoint causes just beneath the outer layer. Samples must be stable, though; too much variation within them, excess moisture, or excessive thickness can block clear results unless handled carefully beforehand.
Looking inside cells? Transmission electron microscopy delivers flat images with detail down to about 0.1 nanometers. Nothing beats it for checking tiny particles, lab-made membranes, and lipid bubbles. Getting samples ready takes precision work. What you see in one frame tends to be limited, though.
What factors should guide my selection of methods while keeping the system straightforward?
Work backwards from the claim you must support:
-Is it just about form? Consider bright-field microscopy – or switch to scanning electron microscopy instead.
-Looking at shape along with movement inside living specimens? Try fluorescence methods. When three-dimensional imaging matters – and radiation must stay minimal – consider switching to light-sheet approaches.
-Imagine chemistry that doesn’t rely on tags. Raman delivers precise identification. Meanwhile, surface plasmon resonance captures binding events as they unfold.
-Hidden interiors or opaque matrices? X-ray or neutron tomography.
-When examining structures at the nano- to sub-nanometre scale, transmission electron microscopy is used. Surface details can alternatively be observed using scanning electron microscopy.
Limitations arise from velocity demands – techniques like light-sheet or imaging flow cytometry impose specific timing needs. Spatial coverage differs across methods: widefield captures broad areas, whereas confocal or tomographic approaches trade breadth for depth. Compatibility with samples introduces additional constraints; some tolerate little photodamage, while others cannot withstand vacuum conditions or high radiation levels.
What resolution and dimensionality should I expect, very roughly?
• Bright-field: 2D, ~200-500 nm.
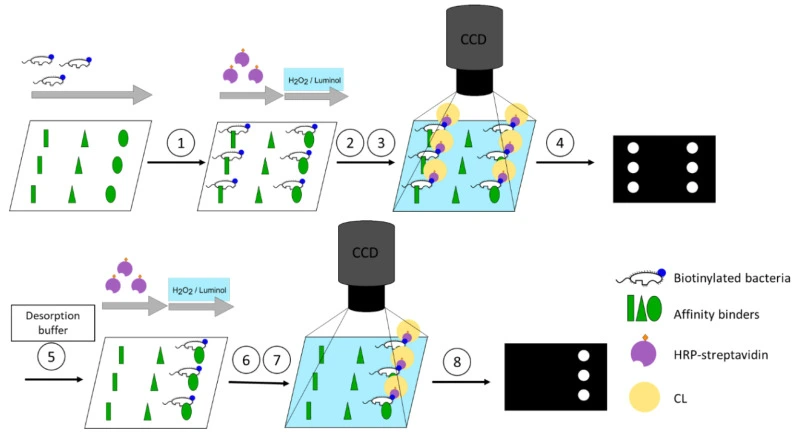
• Chemiluminescence: 2D, pixel-limited; minimal background but little spatial detail.
• Raman: 3D possible, ~0.5-1 µm; chemical maps.
• SPR imaging: 2D, ~1-10 µm; great kinetics.
• Confocal: 3D, ~200 nm lateral / ~500 nm axial.
• Light-sheet: 3D, ~300-500 nm with low phototoxicity.
• Imaging flow cytometry: 2D, ~300-700 nm at high throughput.
• X-ray tomography: 3D, ~1-50 µm (synchrotron) or ~50-500 µm (lab).
• Neutron tomography: 3D, ~16-100 µm; excellent penetration.
• SEM: surface, ~1-10 nm.
• TEM: internal 2D, ~0.1-1 nm.
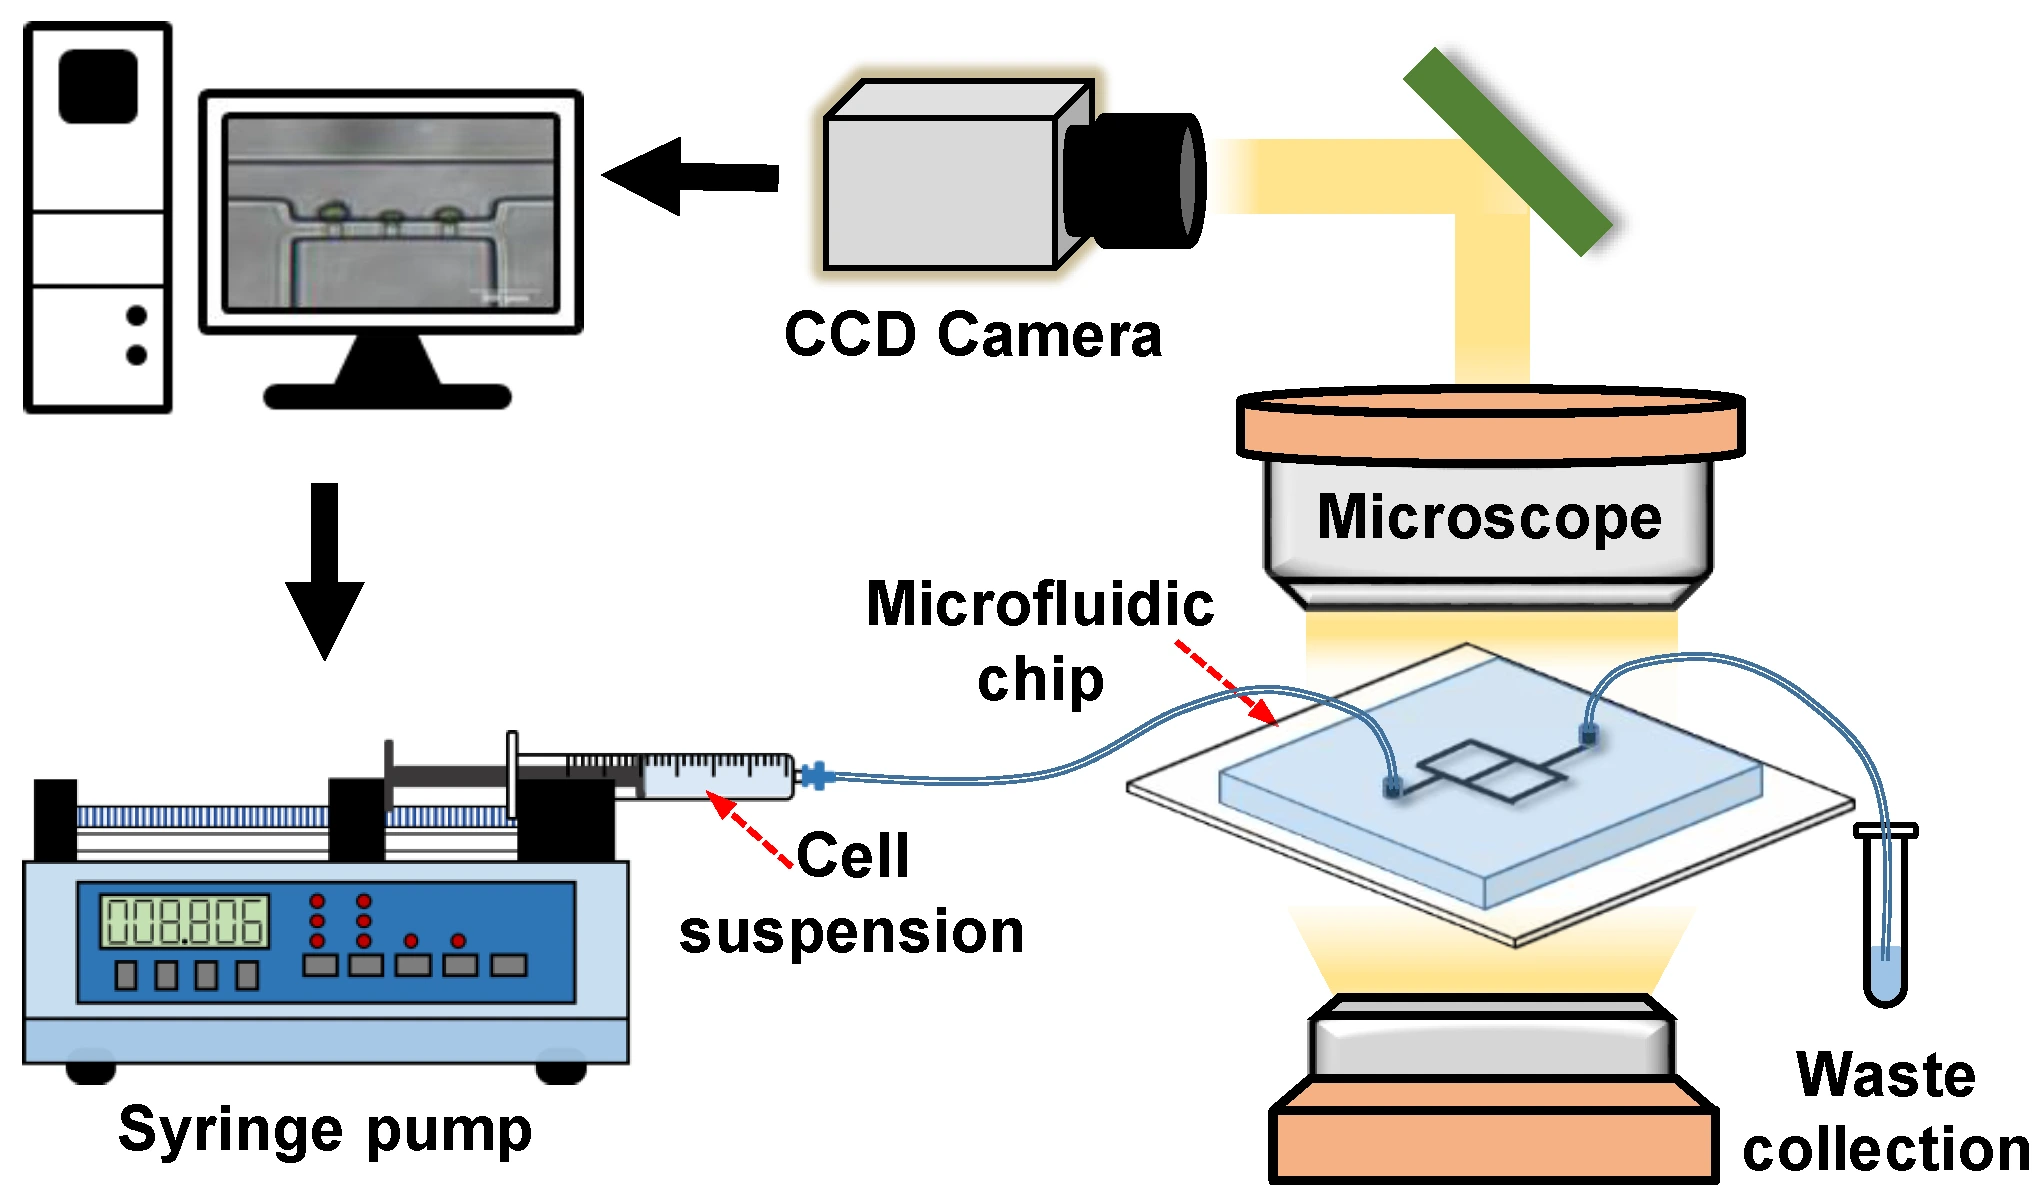
What problems often disrupt microfluidic imaging efforts?
- One common issue in time-lapse photography is excessive exposure to light, which can harm samples. Another appears if researchers ignore limits on total illumination, leading to fading signals. A third emerges as brightness degrades due to unchecked laser intensity.
- When data pours in quickly, confusion often follows if analysis methods aren’t set in advance. Handling varied file types becomes messy without a clear structure. Automatic information division helps, yet many skip setting it up early. Missing details, such as timestamps or labels, weaken later interpretation. Planning steps before collection starts makes a difference down the line.
- When materials used in channels do not align with imaging methods, problems arise. For instance, some polymers glow on their own when exposed to light. Electron beams can cause unwanted charge buildup. Thick hydrogels tend to scatter signals. These issues slow progress. Planning a simple reference chart at the start prevents delays later. Compatibility checks save time down the line.
Will machines and smart systems truly shift how things stand?
True, though only through hands-on improvements. When alignment and data capture run independently, light-sheet and confocal systems remain stable over time. Exposure adjusts itself, reducing cell damage from excessive light. Image analysis powered by algorithms lets flow cytometry sort cells instantly. Speed gains mostly stem from basic tweaks – automating stage movement, focus shifts, and lighting changes based on how clear the picture looks or how strong the signal appears – all this happening well ahead of complex neural networks ever being used.
Imagine a small team building precise lab tools with tiny liquid channels. This group shapes every part of the system needed for clear imaging – designing chips, picking materials, setting up light pathways, managing liquid flow, and then gathering results. One step at a time, they craft early models, refine them, and assist in drafting key technical sections and expected outcomes. When included in EU research bids under Horizon Europe, such dedicated, smaller players often boost approval chances; data hints suggest their role may nearly double the likelihood of funding compared with average rates. Once awarded, this unit handles assembly tasks, freeing university and medical collaborators to stay rooted in discovery.
Ahead of schedule, but pressed for time. Could a minimal, justifiable imaging approach work by month’s end?
- Secure the scientific assertion alongside its limited proof.
- Select one main method, while including a backup such as fluorescence paired with bright-field imaging. Alternatively, combine tomography with SEM when examining samples afterward. This ensures data continuity if the principal approach fails. Using two complementary techniques improves reliability without requiring extra steps during initial analysis. A secondary mode serves as a verification mechanism under challenging conditions.
- Start by outlining the required exposure and a consistent file-naming method.
- Run a materials-compatibility check (optics, radiation, vacuum).
- A single automated collection process is first developed. Following that, a structured review document comes together step by step. One flows into the next without overlap. Each follows its own clear sequence of actions. The two operate separately but align in purpose. Execution happens in order, not all at once.
This amount often suffices for producing figures suitable for publication along with a clear direction – proceed or stop – avoiding prolonged investment in failing paths.
Are the custom chips you build specifically for imaging applications?
Indeed. Custom microfluidic chips are built here, while microscope connections are tailored. Special mounts for tomography come next, followed by embedded sensors and controls that enable self-regulated tests. What arrives is a fully working model, clearly explained, ready for your group to support independently, alongside a detailed guide that ensures consistent image results.
Start early by including the MIC when defining the research direction. Our role adjusts the technological readiness level through practical insights. Work packages featuring advanced imaging – such as organ-on-a-chip systems, porous materials analysis, targeted therapeutics monitoring, or sensor development – take shape with our input. Alignment of results with real-world application paths follows naturally from this foundation. Reviewers pay close attention to partnership composition; here, we strengthen diversity and coherence across partners. Drafting key parts of the proposal happens jointly, ensuring clarity. Budget figures reflect actual prototype requirements, not estimates. Throughout the project lifecycle, assembling the full imaging platform remains an active commitment.